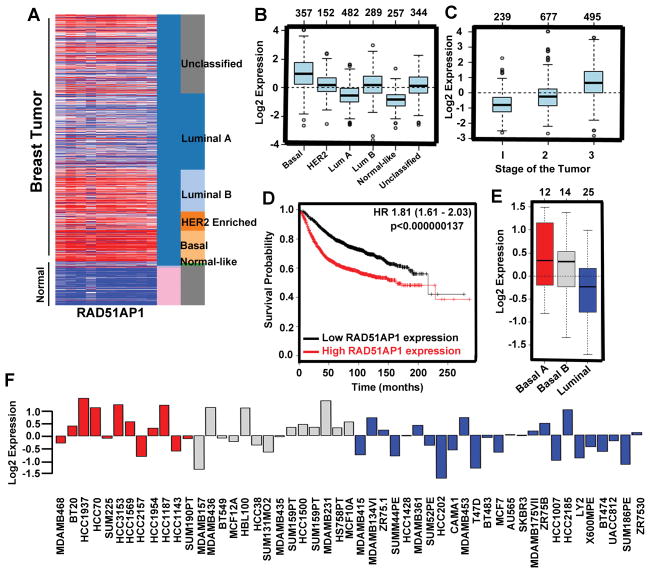
Figure 5.
RAD51AP1 is upregulated in basal breast cancer. A, Heat map generated from the TCGA database showing relative expression of RAD51AP1 gene in normal and different breast cancer subtypes. B, Representative box plot of RAD51AP1 gene expression in different breast cancer subtypes. C, Box plot represents RAD51AP1 gene expression for tumor samples stratified according to histological grade. D, Kaplan-Meier plots represent overall survival of breast cancer patients in whole data sets for breast cancer patients categorized according to RAD51AP1 gene expression. The P-value was calculated using a log rank test. E, GSA tumor Box plots showing RAD51AP1 gene expression in human breast cancer cell lines categorized according to the basal A (red), basal B (grey) and luminal (blue) subgroups. F, Gene expression analysis of RAD51AP1 in 51 breast cancer cell lines.

