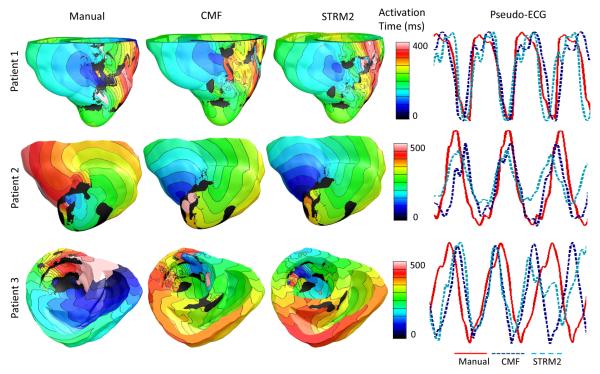
Fig. 7.
Activation maps and pseudo-ECGs from one beat of VTs simulated for three patient hearts, with models that incorporated infarct reconstructions built from segmentations by the different methods. The hearts are numbered the same way as they are in Table V. Activation maps are shown in anterior views of the ventricles for Patient 1 and 2, and in superior view of the ventricle for Patient 3. The VTs were monomorphic except for the one corresponding to Patient 3 and the STRM2 method.

