Fig. 6.
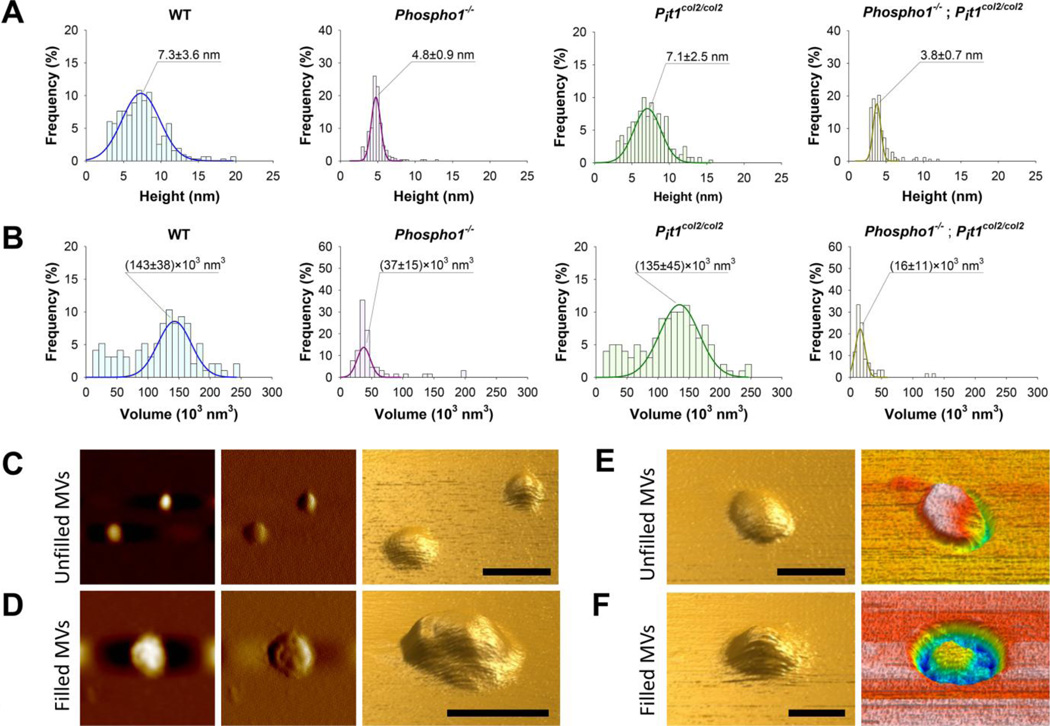
Atomic force microscopy (AFM) images were recorded in non-contact (AAC) mode. Height (A) and volume (B) distributions were calculated for MVs isolated from WT, Phospho1−/−, Pit1col2/col2 and [Phospho1−/−; Pit1col2/col2] mice. MV volumes were calculated by assuming MVs as spheroidal structures (see Supplemental Figure 4B). All peaks were fitted by Gaussian curves. C-F) Images of mineral aggregate-unfilled (C and E) and filled (D and F) WT (C, D and F) and Phospho1−/− (E) MVs. From left to right: topography image, amplitude image and three-dimensional reconstruction of topography image (C and D); three-dimensional reconstructions of topography and phase images (E and F). Scale bars = 100 nm.

