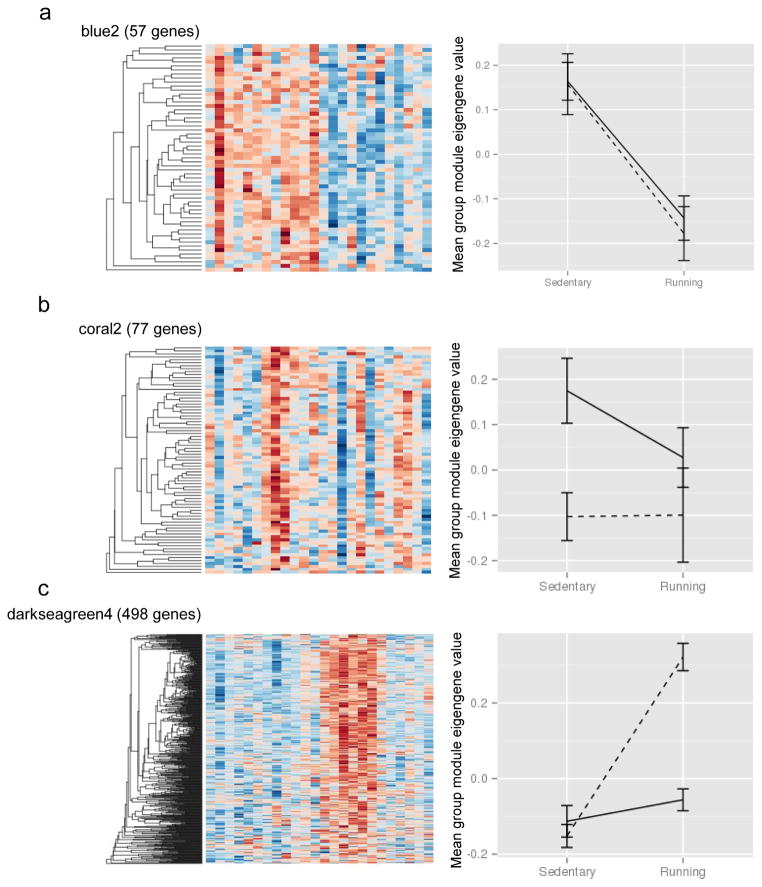
Figure 4.
Representative modules corresponding to each effect. Heat maps depict log2 normalized expression levels for each gene (rows) in the module, blue colors represent lower expression, red colors represent higher expression. Each column represents one mouse sample. Line graphs are plots of corresponding module eigenGene, grouped by treatment. Dashed lines are water-only mice, solid lines are ethanol-consuming mice. The blue2 module is representative of a main effect of running (A). The coral2 module shows a main effect of ethanol consumption (B). The darkseagreen4 module displays an interaction effect (C).

