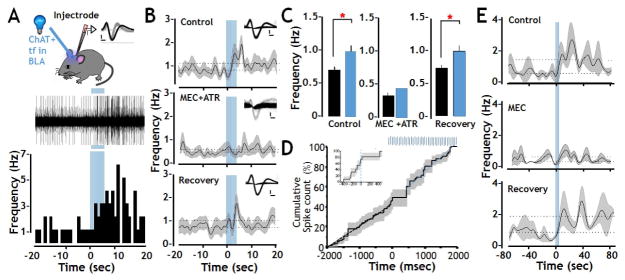
FIGURE 3. Enhanced firing of BLA principal neurons elicited by photo-activation of oChIEF expressed in cholinergic terminal fields in vivo.
A: Top: Schematic of the recording configuration allowing optical stimulation of cholinergic projection fibers in the BLA with simultaneous extracellular recording. The inset shows sample waveforms obtained from a regular spiking unit that was included in analysis (black) and a fast spiking unit whose cellular identity was ambiguous and was therefore excluded from analysis (grey). Calibration: 500 mV X 0.2 msec. Middle and bottom: Representative traces from one of the 38 regular spiking neurons and the corresponding peri-stimulus histogram illustrating the modulation of spontaneous spike frequency after delivery of 100 pulses of 473 nm light (indicated by vertical blue bars; Spike amplitude: 200mV, optical stimulation duration: 5 s).
B: Population (n=19) frequency vs peri-stimulus time plots recorded before, during and after photo-activation of cholinergic terminal fields in the BLA during infusion of artificial CSF (control), of both AChR antagonists (MEC + ATR at 10μM and 500 nM, respectively) and after antagonist washout (Recovery). During the control period opto-stimulation evoked a statistically significant increase in firing frequency (from 0.71 Hz to 0.99 Hz). In the presence of MEC+ATR the baseline firing frequency was suppressed by more than 50% (0.32 Hz). Subsequent photo-stimulation in the presence of these AChR antagonists did not change unit activity. Both the baseline BLA firing rate and the excitatory response to photo-stimulation recovered after antagonist washout. Insets show sample waveforms of a representative unit before, during and after drug administration. Dotted lines show the average firing frequency obtained during the 20 s before and after optical stimulation. The black line represents the instantaneous mean frequency, while the shaded areas represent standard error of the mean (Calibration 500 mv X 0.2 msec).
C: Statistical analysis of firing rates obtained pre (black) and post (blue) photo-stimulation of cholinergic terminal fields within the BLA shows a significant excitatory response to opto-stimulation during the control/vehicle period and after saline wash out, but not in the presence of AChR antagonists (control n = 19, MEC+ATR n = 14, Recovery n = 14, within condition paired t-tests * p < 0.05, data shown as mean + SEM).
D: Cumulative spike count before and after photo-stimulation of cholinergic terminal fields (n=38 units) shows an approximately 400 msec pause in firing immediately after the onset of optical stimulation of cholinergic signaling (indicated by the blue bars) prior to the increase in firing rate seen in all 38 units. Inset: cumulative spike count over a narrower time range, before and during onset of photo stimulation.
E: Frequency vs peri-stimulus time plots of recordings obtained before, during and after photo-activation of cholinergic terminal fields in the BLA under control conditions, or in the presence of mecamylamine (20 μM). Blue bars represent the timing of the opto-stimulation. Dotted lines show the average firing frequency obtained during the 80 s before and after optical stimulation. The black line represents the instantaneous mean frequency, while the shaded areas represent standard error of the mean. See also Fig S2, S3 and S4.

