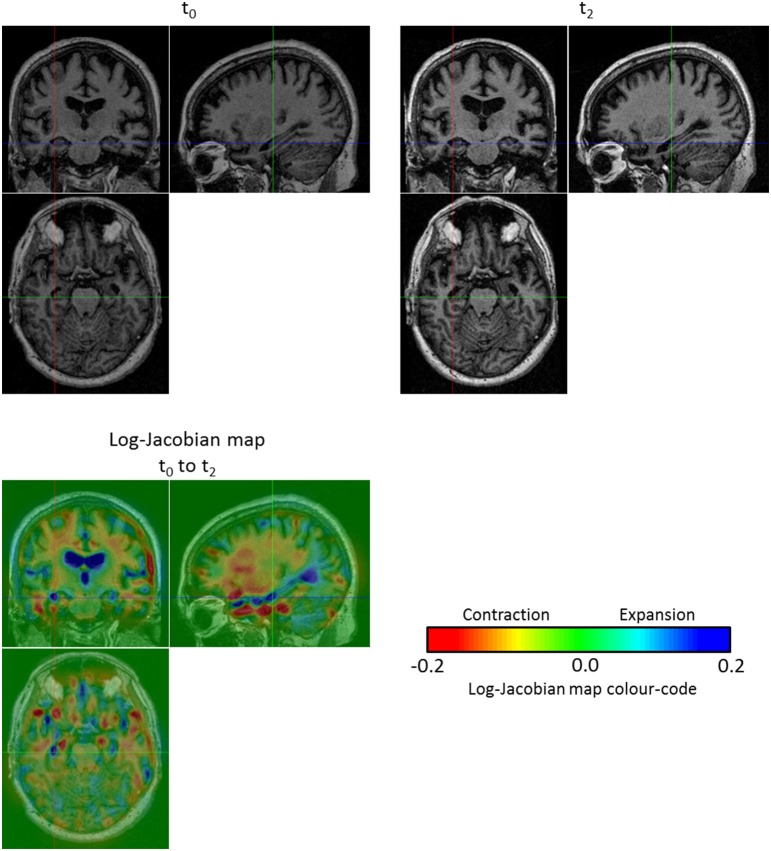
Figure 7.
Log-Jacobian map for the subject OAS2_0002. We computed the log-Jacobian map—which represents the relative change of volume—for the SVF of the longitudinal evolution between t0 and t2. We can observe an expansion in the ventricles and more particularly in the temporal horn of the lateral ventricles and a contraction in the hippocampi. Moreover, although there is an artifact outside the brain (left hand edge of the follow-up image at t2), the use of the non-linear registration with confidence mask enables us to avoid any artifactual volume change in our log-Jacobian map.

