
FIGURE 3.
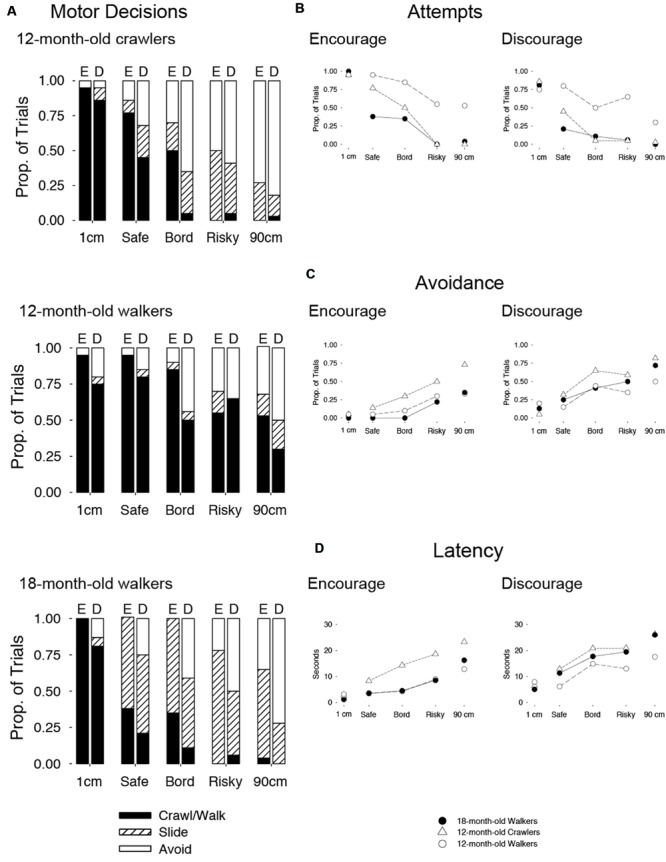
(A) Stacked bar graphs show the average proportion of trials in, which 12-month-old experienced crawlers, 12-month-old novice walkers, and 18-month-old experienced walkers attempted to crawl or walk (black bars), used alternative descent strategies (striped bars), or avoided descent (white bars) in the encouraging “E” and discouraging “D” conditions. The x-axis is labeled with five drop-off increments in order of increasing risk: 1-cm, safe (-6-cm smaller than infants’ borderline drop-off), borderline drop-off, risky (+6-cm larger than infants’ borderline drop-off), and 90-cm drop-off. Line graphs show (B) proportion of trials in which infants attempted to crawl or walk and (C) avoid. (D) Latency (seconds) graphs show hesitation on the starting platform in each locomotor group.