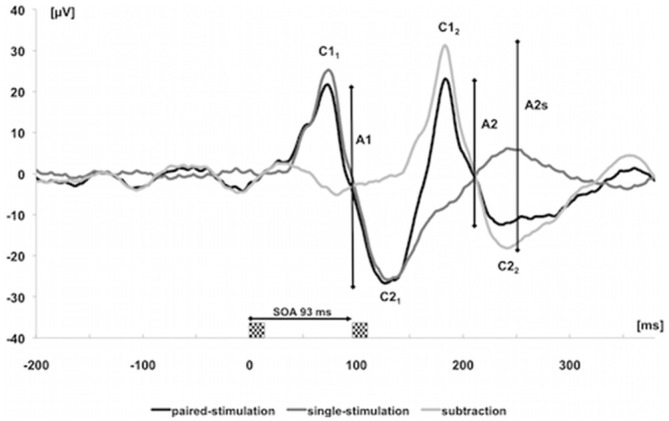
Figure 2.

Visually evoked potentials (VEPs) over cortical Oz of one subject after single (dark gray trace) and paired stimulation with stimulation onset asynchrony (SOA) of 93 ms (black trace). The label C was used to characterize the positive and negative components of the first and second response. The light gray trace results by subtracting the single-stimulation trace from the paired-stimulation trace. The analyzed amplitudes of the first response (A1 = C21–C11) and second response (A2 = C22–C12) after paired stimulation are marked by vertical bars; amplitudes of the second response after subtracting the response to a single stimulation are labeled as amplitudes of the second (A2s).
