Figure 5.

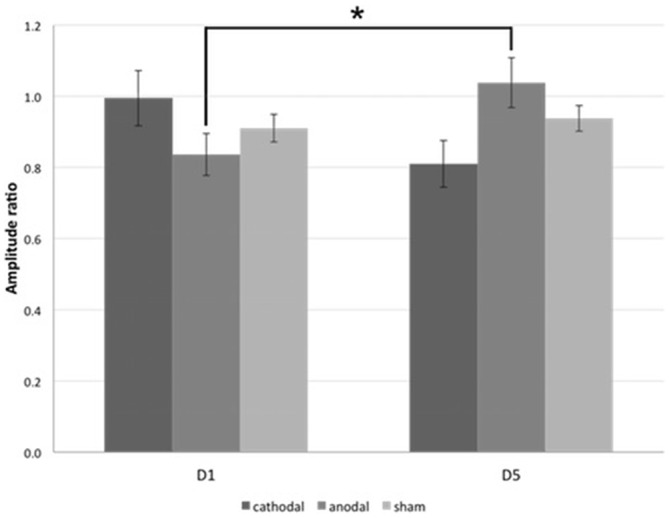
Paired-stimulation VEP (psVEP). Mean amplitude ratios of all three groups on D1 and D5 are plotted. *significance level, p < 0.017. Error bars indicate standard error of the mean.

Paired-stimulation VEP (psVEP). Mean amplitude ratios of all three groups on D1 and D5 are plotted. *significance level, p < 0.017. Error bars indicate standard error of the mean.