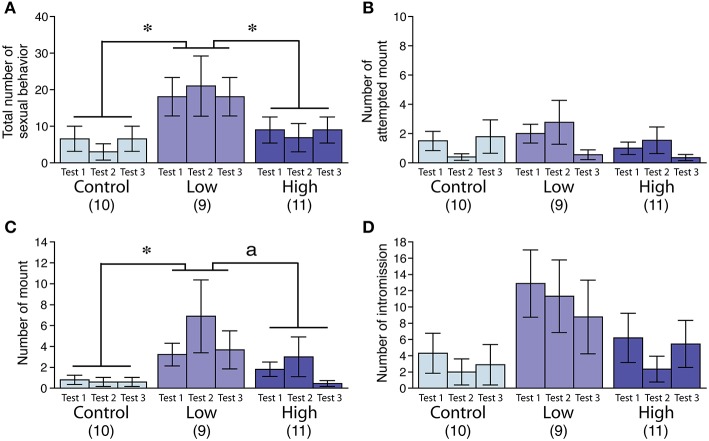
Figure 2.
Effects of developmental ACE exposure on male sexual behavior. Comparison of (A) the total number of sexual behaviors, as well as the numbers for each male sexual behavior component, including (B) attempted mounts, (C) mounts, and (D) intromissions across the treatment groups. The numbers of animals used are indicated in parentheses. The data are presented as the mean ± SEM. *P < 0.05, aP < 0.1.

