
Figure 7.
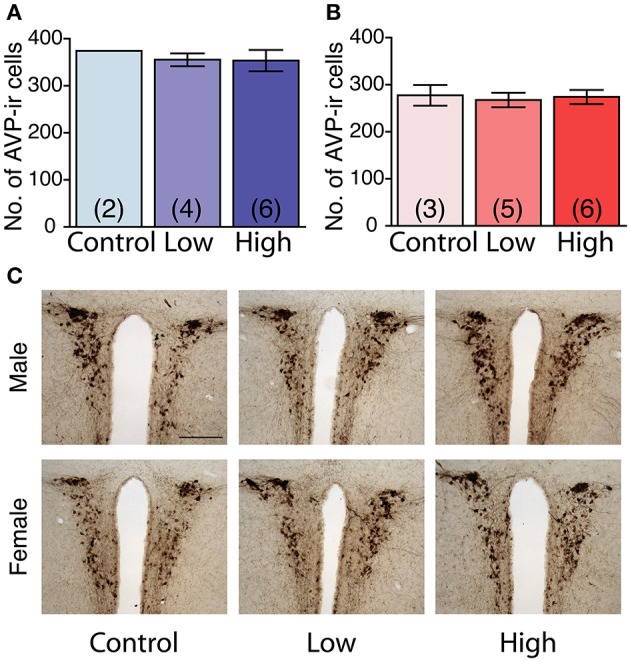
Effects of developmental ACE exposure on the number of vasopressin (AVP) immunoreactive (ir) cells in the paraventricular nucleus (PVN). (A) Male and (B) female mice of each treatment group. The data are presented as the mean ± SEM. (C) Representative photomicrographs of AVP-ir cells in brain sections from males (top panels) and females (bottom panels) of each treatment group. The numbers of animals used are indicated in parentheses (A,B). The scale bar represents 200 μm.