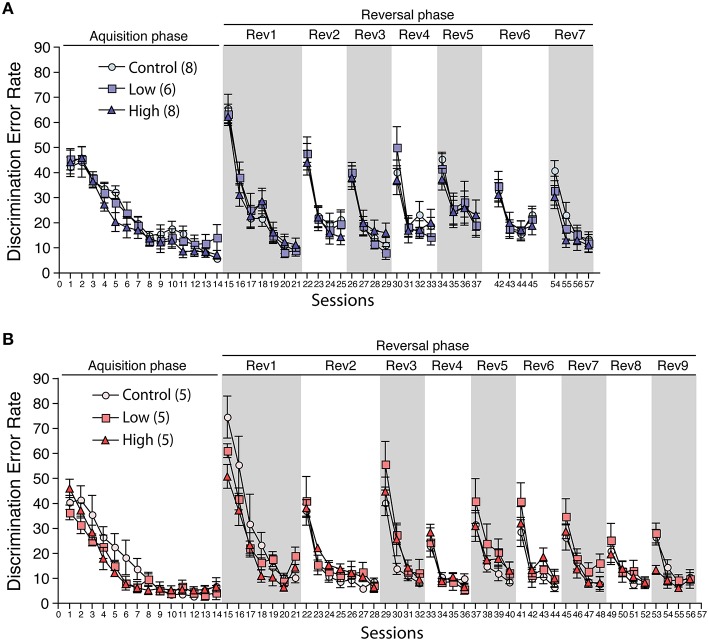
Figure 8.
Effects of developmental ACE exposure on behavioral flexibility. The comparison of the discrimination error rates (the number of discrimination errors in the first 100 corner visits in the session) in (A) male and (B) female mice. The numbers of animals used are indicated in parentheses. The data are presented as the mean ± SEM. The data for session 38–41 (6th reversal phase) and session 46–53 (8th and 9th reversal phases) in male were omitted due to the technical issues with the IntelliCage apparatus. Thus, the session 42 to 45 is denoted as Rev 6 and the session 54–57 is denoted as Rev 7 on (A).

