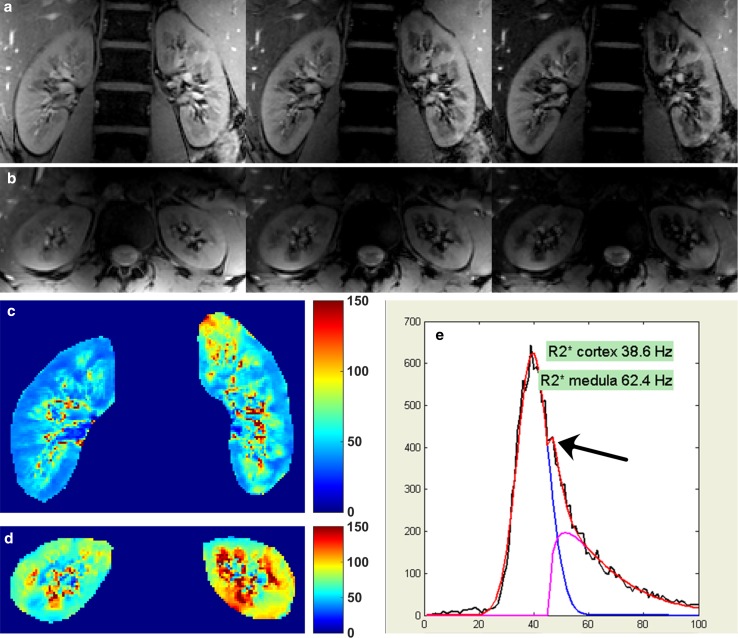
Fig. 11.
T 2*-weighted images: a coronal images (echo times 4.9, 9.9 and 14.8 ms); b transversal image (echo times 4.9, 9.9 and 14.8 ms); c, d corresponding R 2* maps; e histogram of the R 2* values. In the compartmental method, the sum of a Gaussian function (red) representing the cortex and a gamma function (purple) for the medullary values is fitted to the histogram. Arrow distinct peak of medullary voxels, not visible on 3T data (Hoogduin et al. [37])

