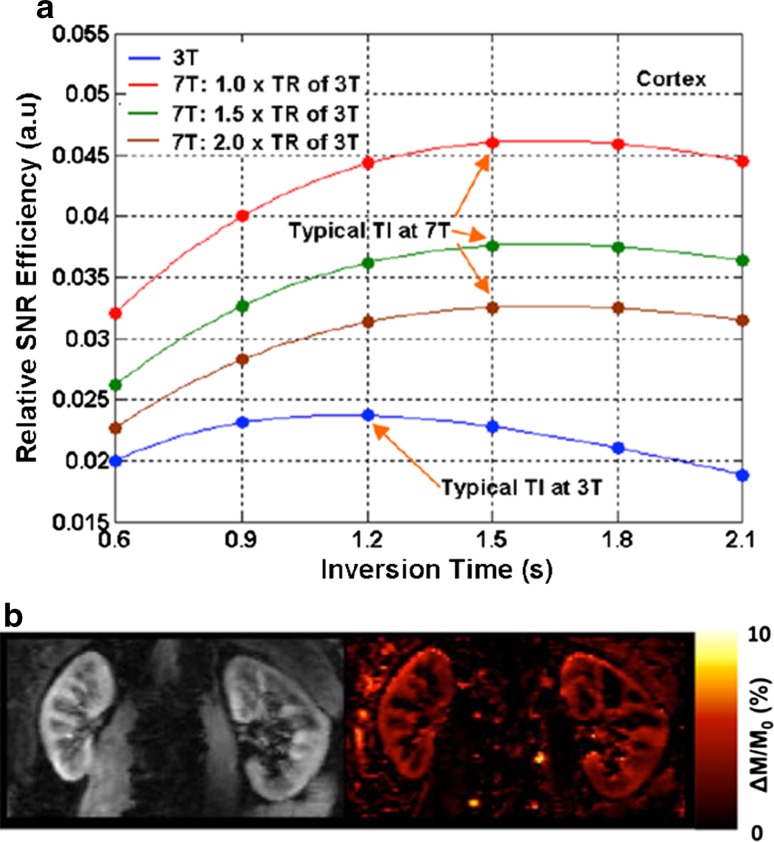
Fig. 12.
a Theoretical simulations of renal perfusion SNR efficiencies at 3 T and 7 T for renal perfusion imaging using FAIR EPI. TR represents repetition time. b One subject’s proton (left) and normalized perfusion-weighted (right) images from perfusion study using FAIR-EPI at 7 T with 2 × 2 × 5 mm3 resolution. ΔM represents perfusion-weighted signal evaluated as the signal difference between label and control images, and M 0 the fully relaxed renal tissue signal (Li et al. [48])

