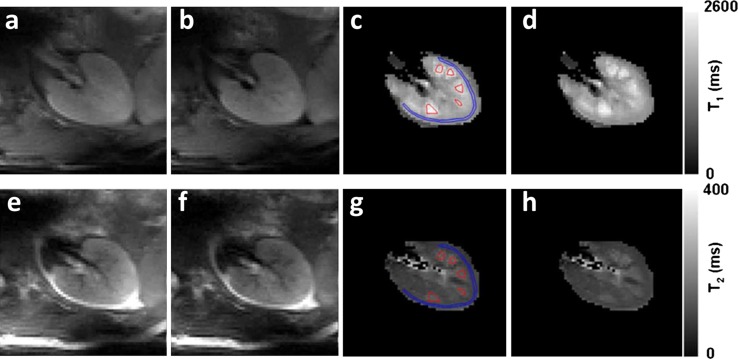
Fig. 7.
a, b ss-FSE images for T 1 measurement with inversion time 100 and 150 ms, respectively; c, d T 1 maps with and without ROIs for T 1 estimation; e, f ss-FSE images for T 2 measurement with effective echo time 20 and 40 ms; g, h T 1 maps with and without ROIs for T 1 estimation (all ss-FSE images were acquired at six different inversion times or effective echo times to minimize short-term SAR) (Li et al., reprinted with permission from [8])

