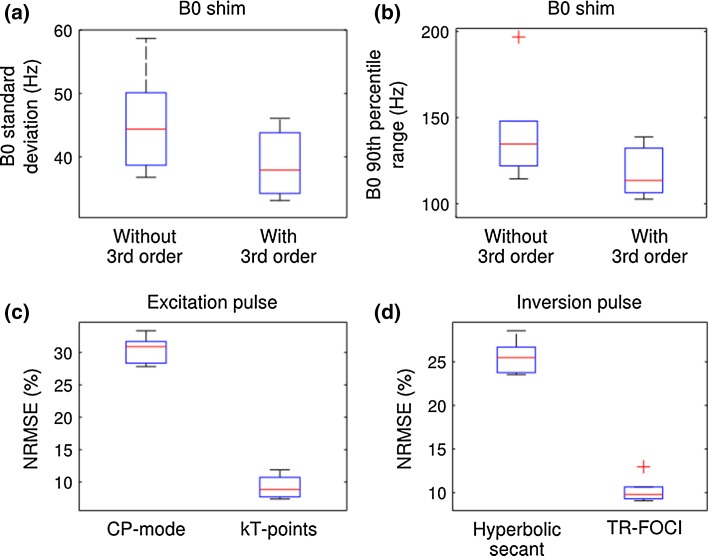
Fig. 6.
Box plots of a the standard deviation and b the 90th percentile range of B0 distributions after shimming with and without including the 3rd order coils; and the normalised RMSE of c the CP-mode and kT-points excitation pulses and d the Hyperbolic secant and TR-FOCI inversion pulses. In each box, the central mark is the median; the edges of the box are the 25th and 75th percentiles. The whiskers extend to the most extreme values which are not outliers, and the outliers are plotted as red crosses individually

