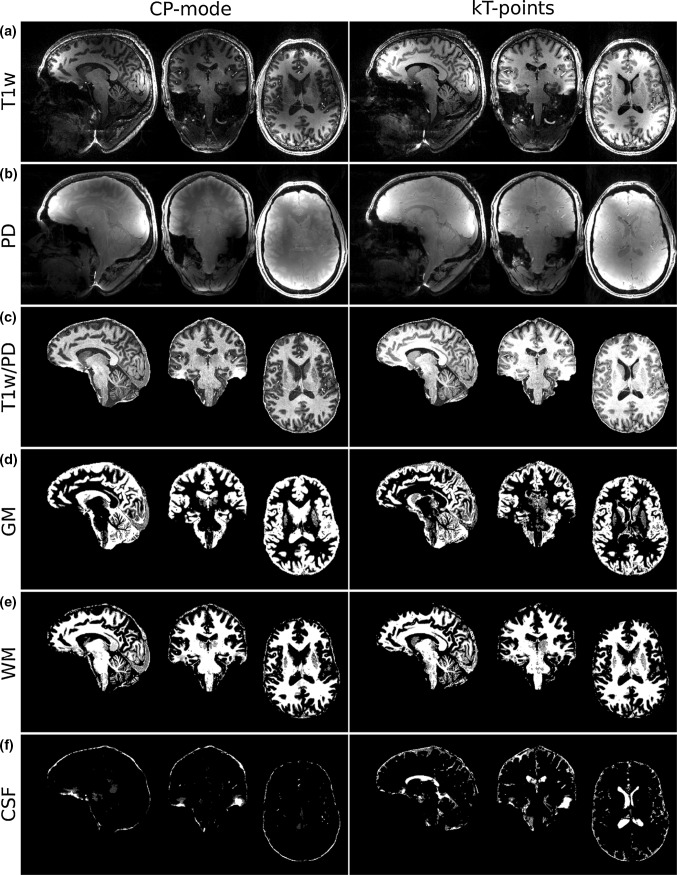
Fig. 7.
a T1-weighted MPRAGE image using TR-FOCI inversion and CP-mode excitation (left column) and kT-points excitation (right column). The intensities in both columns are scaled identically. b Proton density image using kT-points. c Brain extracted and receive bias corrected T1-weighted image from a and b. d–f Grey matter, white matter and cerebrospinal fluid tissue probability maps extracted from c using FSL-FAST

