
Fig. 5.
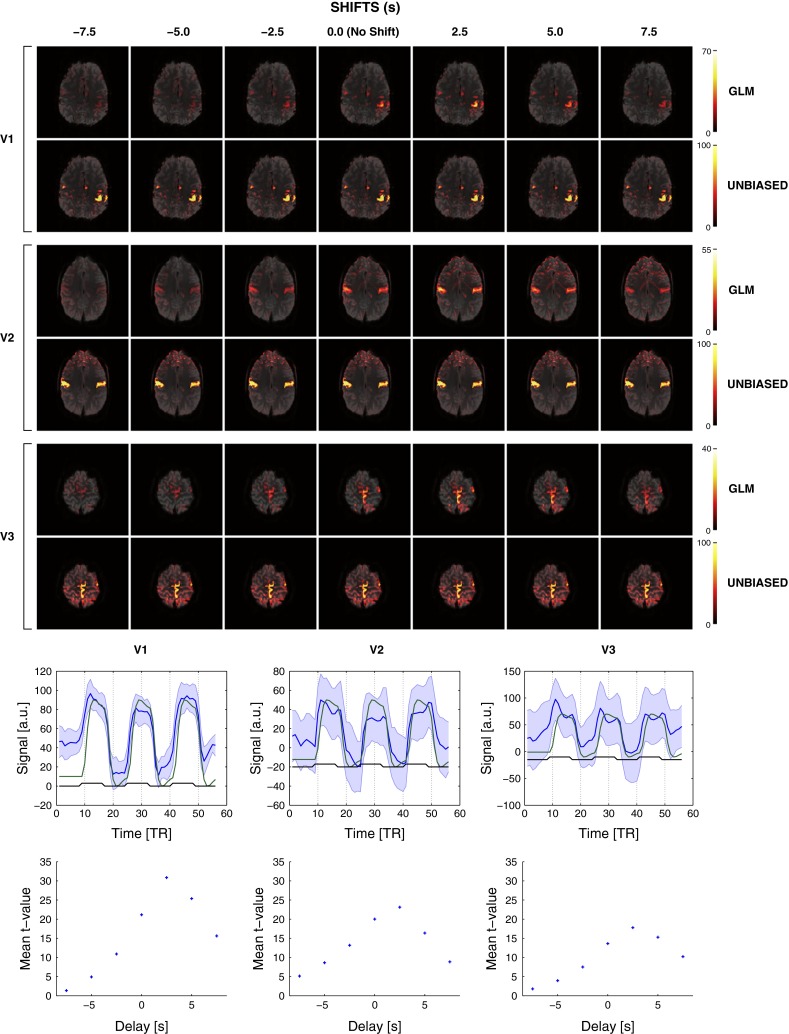
Top Effect of delayed responses in GLM (top rows) and UNBIASED (bottom rows) analyses illustrated for the hand, chin, and foot tasks. The impact on magnitude and extent of activation for shifts of 2.5 s (1 TR) in the time courses from −7.5 to 7.5 s are shown. Overlays are presented with a transparency of 25 % in radiological convention. Bottom (top row) Plots of the average time courses (blue line) and standard deviation (blue shaded area) in a cubic ROI centred at the activation area (no time course shift) for all tasks. Green and black lines represent the GLM regressor and task timing, respectively. Bottom row Average t values calculated in the same ROI for time course shifts of 2.5 s from −7.5 to 7.5 s. For all tasks, the highest average t values were obtained for a shift of +2.5 s