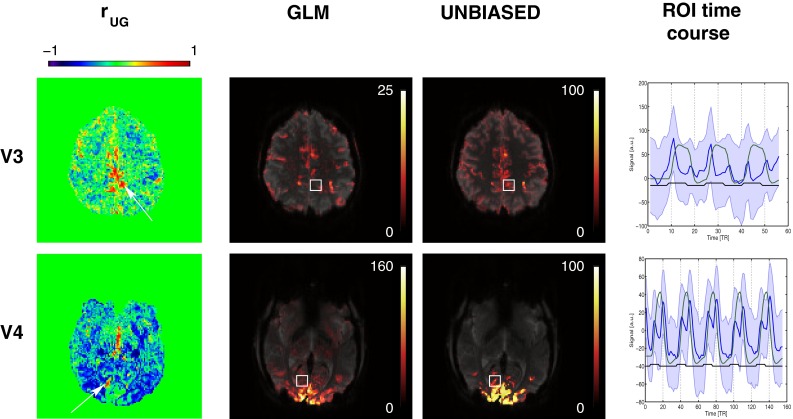
Fig. 8.

Left column Maps of for two volunteers who had regions with modified response shapes and discrepancies between GLM and UNBIASED results. White arrows point to clusters of (better quality of fit in UNBIASED). Middle columns GLM (left) and UNBIASED (right) activation and reliability maps in radiological convention (25 % transparency). Right column Plots of the mean (blue line) and standard deviation (blue shaded area) time courses in cubic ROIs (white boxes centered at the clusters with ). Green lines represent the GLM model regressor and black lines the stimulus timing
