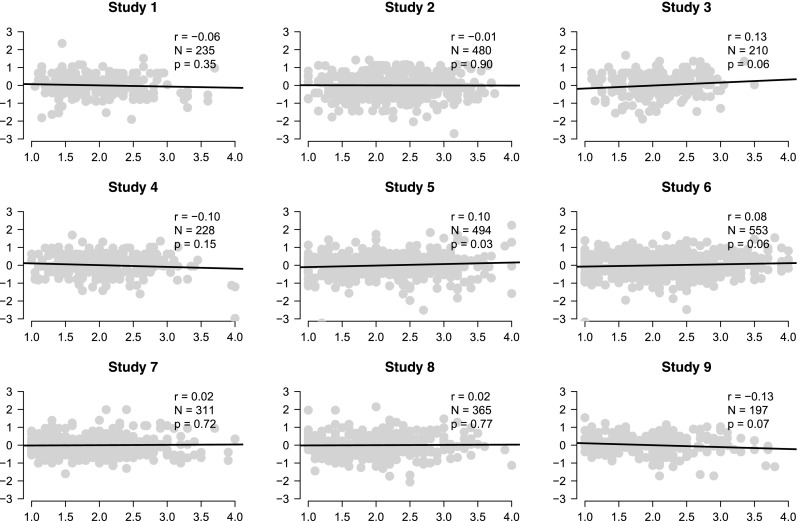
Fig. 1.

Data for the nine replication experiments from Donnellan et al. (in press). Scores for the loneliness scale are on the x-axis and scores for the physical warmth index are on the y-axis. Each panel also shows the sample Pearson correlation coefficient r, the number of observations N, and the two-sided p value
