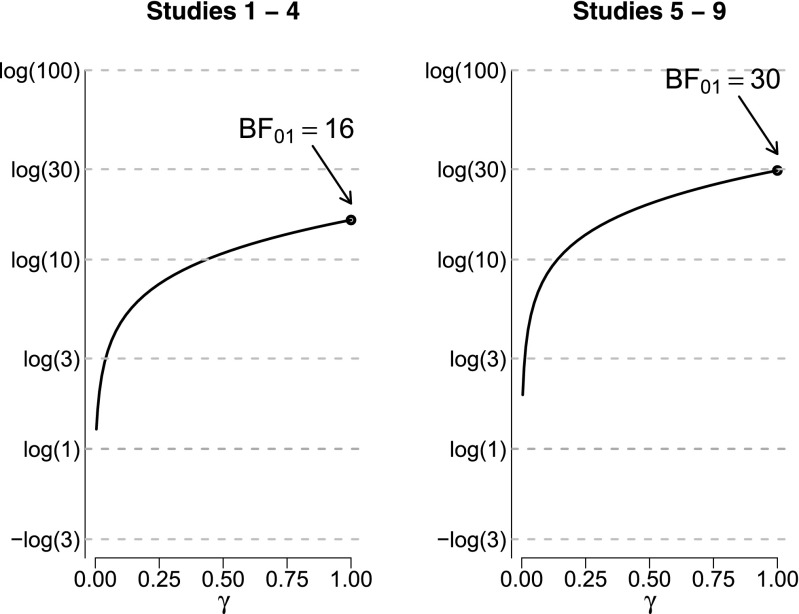
Fig. 4.
Sensitivity analysis for the Bayes factor BF01, collapsing data across studies 1–4 (left panel) and across studies 5–9 (right panel) from Donnellan et al. (in press). The log of the Bayes factor BF01 is on the x-axis and the prior width γ is on the y-axis. When γ = 0 the alternative hypothesis equals the null hypothesis; when γ = 1 the alternative hypothesis is ρ∼U(−1,1). See text for details

