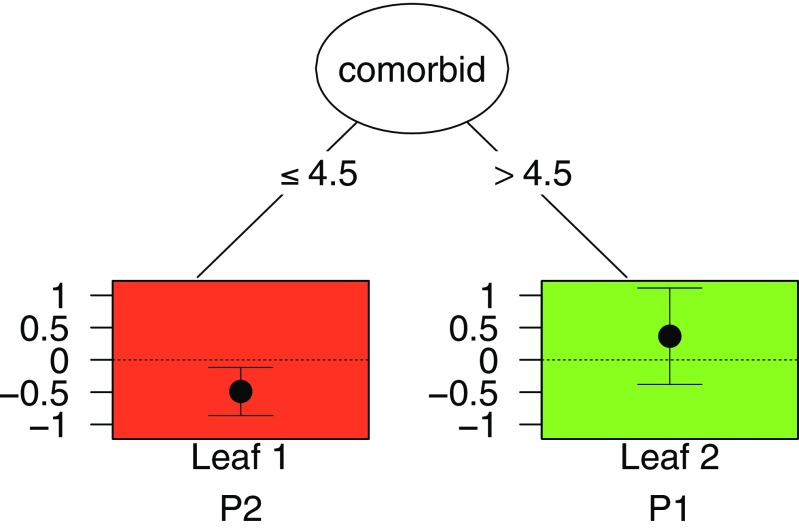
Fig. 2.
Example of a qualitative interaction tree for the outcome Improvement in physical functioning from the Breast Cancer Recovery Project data, using default values of the tuning parameters. The leaves of the tree are assigned to subgroups ℘ 2 and ℘ 1, denoted in the figure by P2 and P1. The vertical axis of the leaves pertains to the effect size d

