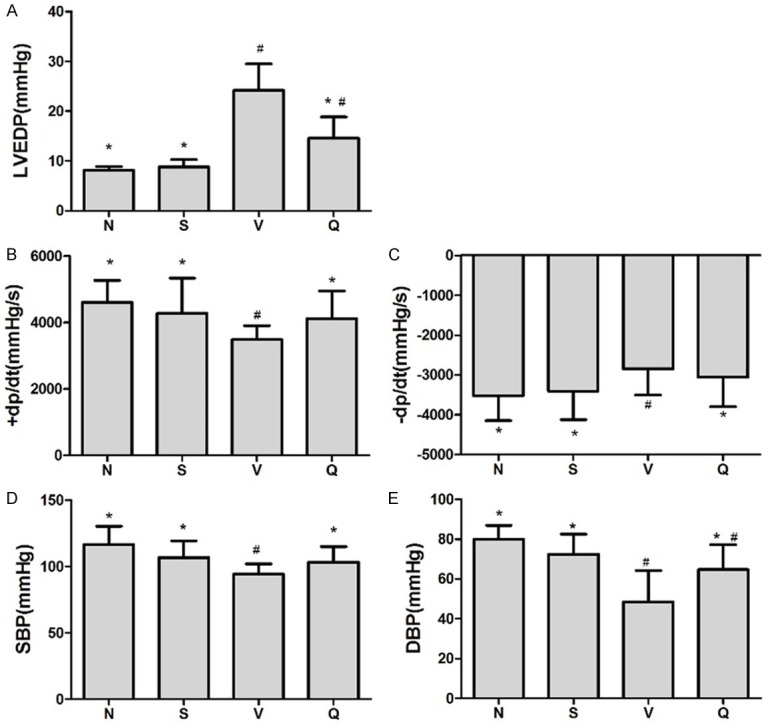
Figure 2.

Hemodynamic assessments of left ventricular end-diastolic pressure. Cardiac function assessed by intraventricular pressure measurement, graphs show (A) LVEDP; (B and C) The maximum positive and negative values of dP/dt; (D and E) Systolic pressure (SBP) and diastolic pressure (DBP). QL treatment showed improved cardiac systolic function in HF rats induced by chronic MI compared with V group including lower LVEDP, increased +dp/dt, -dp/dt and SBP; DBP in Q group also increased to some extent although it was still lower than N group (P=0.029) but showed no significant difference comparing with S group. Values are mean ± SD, *P<0.05 vs. V group; # P<0.05 vs. N group.
