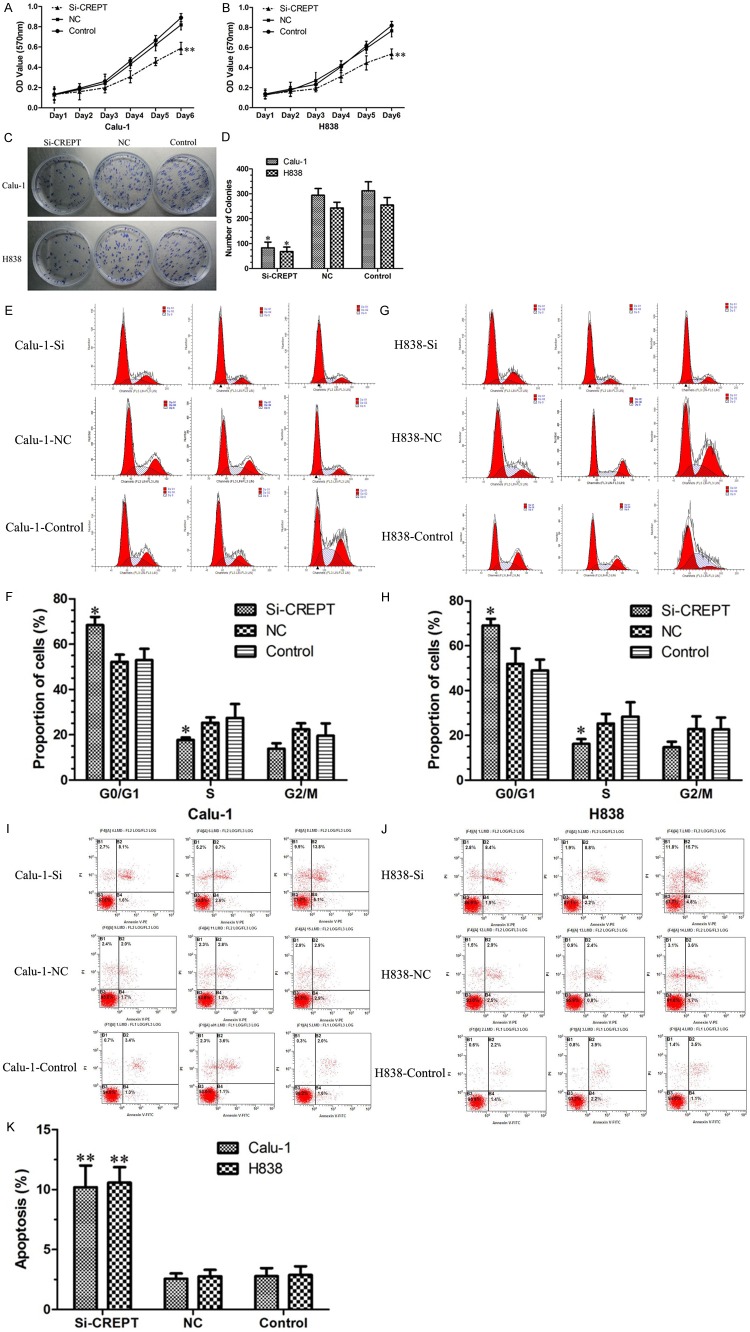
Figure 3.
Down regulation of CREPT expression inhibited the proliferation of Calu-1 and H838 cells. A, B. MTT assays suggest that CREPT-siRNA depressed the growth curves of Calu-1 and H838 cells as compared with NC-siRNA and blank contro with time-dependent manner. C, D. Colony formation assays showed that the CREPT-siRNA inhibited the number of cells and clones as compared with NC-siRNA and blank control. Data are the number of colonies formed expressed as mean ± SD. E-H. The percentage of cells in different phases of the cell cycle was determined. G1-phase population was significantly increased, whereas the S-phase population was reduced in the CREPT-siRNA groups compared to the NC-siRNA and blank control groups (P<0.05). I-K. Knockdown of CREPT expression increased cell apoptosis in the CREPT-siRNA groups compared to the NC-siRNA and blank control groups (P<0.01).* indicates P<0.05, ** indicates P<0.01.

