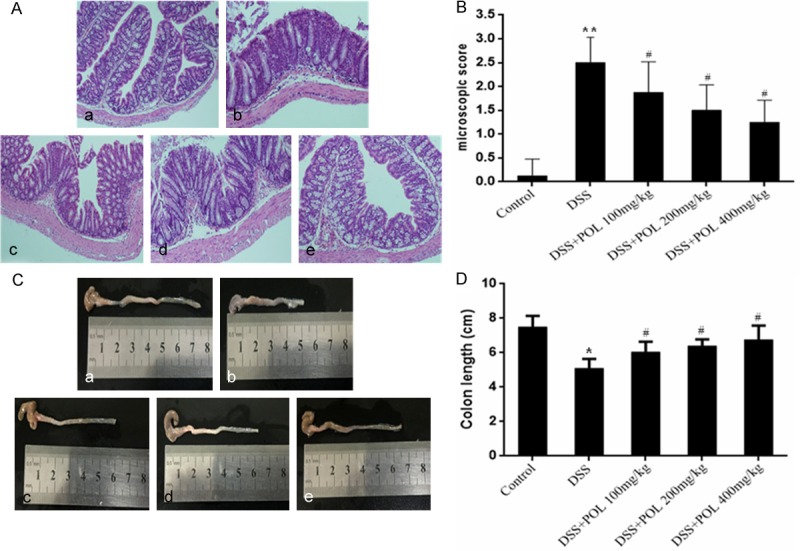
Figure 2.

Effect of POL on histopathological changes and colon length in DSS induced UC. (A) The representative images of HE staining (a) control group (b) DSS (c) DSS+POL 100 mg/kg (d) DSS+POL 200 mg/kg (e) DSS+POL 400 mg/kg and (B) the microscopic score were studied for histological evaluation. Data are presented as the median. (n = 8 for each group). (C) The colon of different groups (a) control group (b) DSS (c) DSS+POL 100 mg/kg (d) DSS+POL 200 mg/kg (e) DSS+POL 400 mg/kg and (D) the colon length were compared on the 7th day. Data are presented as mean ± SD. (n = 8 for each group). *P<0.05 vs sham, **P<0.01 vs sham, #P<0.05 vs DSS.
