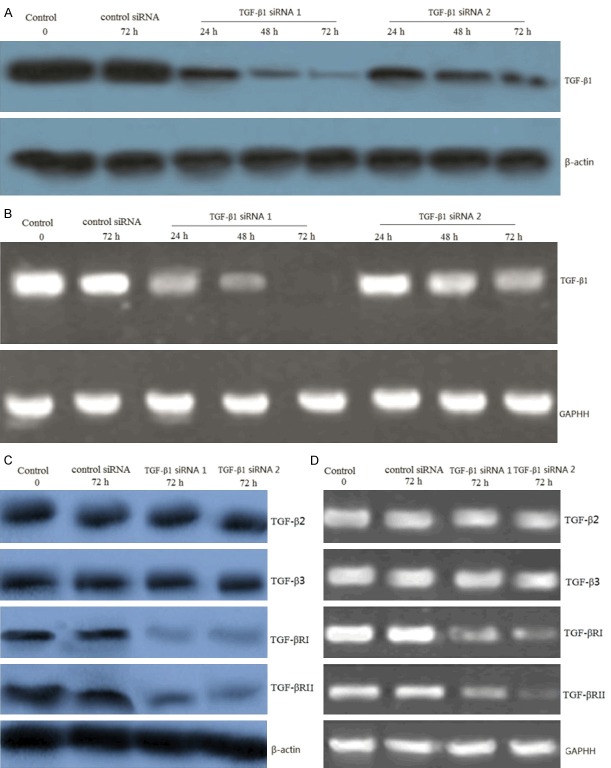
Figure 1.
TGF-β1 gene knockdown by siRNA transfection in 8505C cells. 8505C cells were transfected with TGF-β1 siRNA and control siRNA for 24-72 hs. A. Representative images showing expression of TGF-β1 protein in control siRNA and TGF-β1 siRNA transfected cells as analyzed by Western blot. B. Representative images showing expression of TGF-β1 mRNA in control siRNA and TGF-β1 siRNA transfected cells as analyzed by RT-PCR. C. Representative images showing expression of TGF-β2, TGF-β3, TGF-βRI and TGF-βRII protein in control siRNA and TGF-β1 siRNA transfected cells (72 h transfection) as analyzed by Western blot. D. Representative images showing expression of TGF-β2, TGF-β3, TGF-βRI and TGF-βRII mRNA in control siRNA and TGF-β1 siRNA transfected cells (72 h transfection) as analyzed by RT-PCR. β-actin and GAPDH was as a control.

