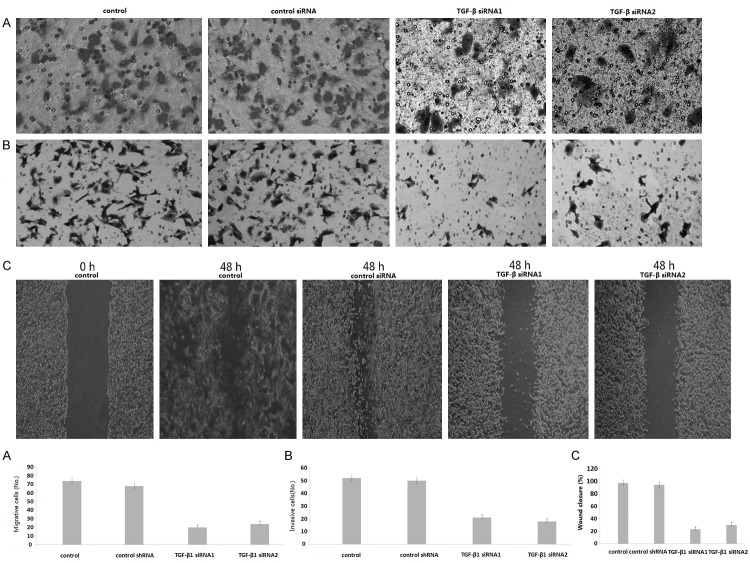
Figure 2.
Knockdown of TGF-β1 inhibits invasion and migration in 8505C cells. A. Cells were detected by transwell migration assay. Migrated cells were counted in five random fields of each filter under a microscope using a 200 × magnification. The scale bar indicates 200 μm. Bars represent the average number of migrated cells. B. The migration of TGF-β1-knockdown 8505C cells. Cells were detected by matrigel invasion assay. Cells that invaded across the matrigel of the transwell were counted in five random fields of each filter under a microscope using a 200 × magnification. The scale bar indicates 200 μm. Bars represent the average number of invaded cells. C. Cells were detected by wound-healing assay. The photographs were taken by microscope using a 100 × magnification at the same area at 0 h and after 48 h of incubation of five random fields. The scale bar indicates 50 μm. Bars represent the average number of invaded cells. *P < 0.01 compared with respective controls.

