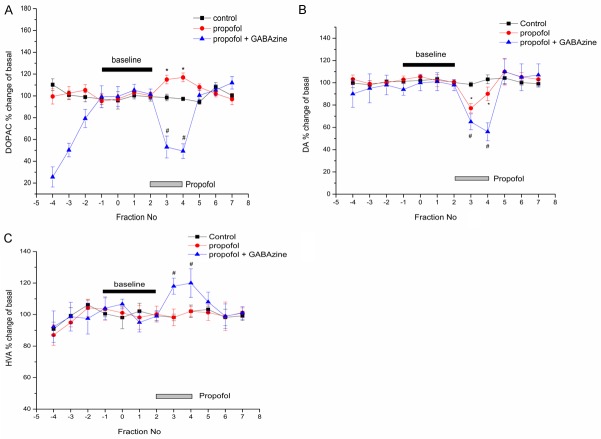
Figure 5.
Effects of propofol on the extracellular concentration of DA and its metabolites DOPAC and HVA. Each graph showed the concentration of neurotransmitters expressed as the percentage of baseline. We defined the baseline concentration is the mean of four consecutive values before intravenous infusion of propofol. X-axis represents the number of collecting dialysate. Dialysate fraction was collected every 30 min. *p < 0.05 against saline group value at each fraction. Values are expressed as mean ± SD, and n = 6 per each group.

