
Figure 5.
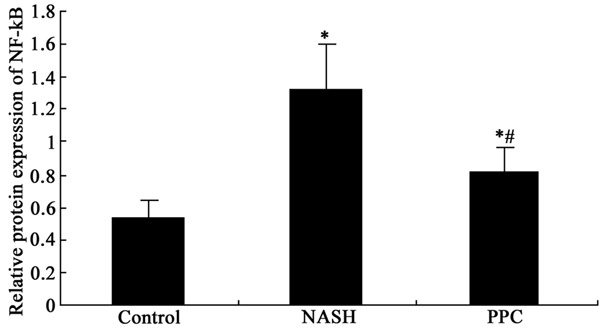
PPC impact on NF-κB protein level in the liver tissue of NASH rat analysis. *P < 0.05, compared with control; #P < 0.05, compared with NASH group.
Official websites use .gov
A
.gov website belongs to an official
government organization in the United States.
Secure .gov websites use HTTPS
A lock (
) or https:// means you've safely
connected to the .gov website. Share sensitive
information only on official, secure websites.
PPC impact on NF-κB protein level in the liver tissue of NASH rat analysis. *P < 0.05, compared with control; #P < 0.05, compared with NASH group.