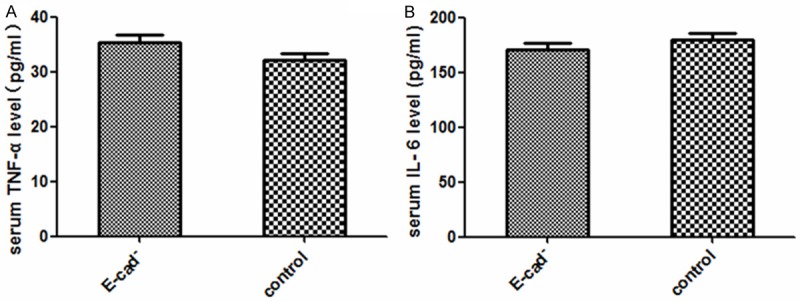
Figure 4.

Observation of the TNF-α and IL-6 protein. A. Compare with control group, the expression level of TNF-α in serum of E-cad- group showed no statistical significance (P>0.05); B. Compared with control group, the expression level of IL-6 in serum of E-cad- group had no statistical significance (P>0.05).
