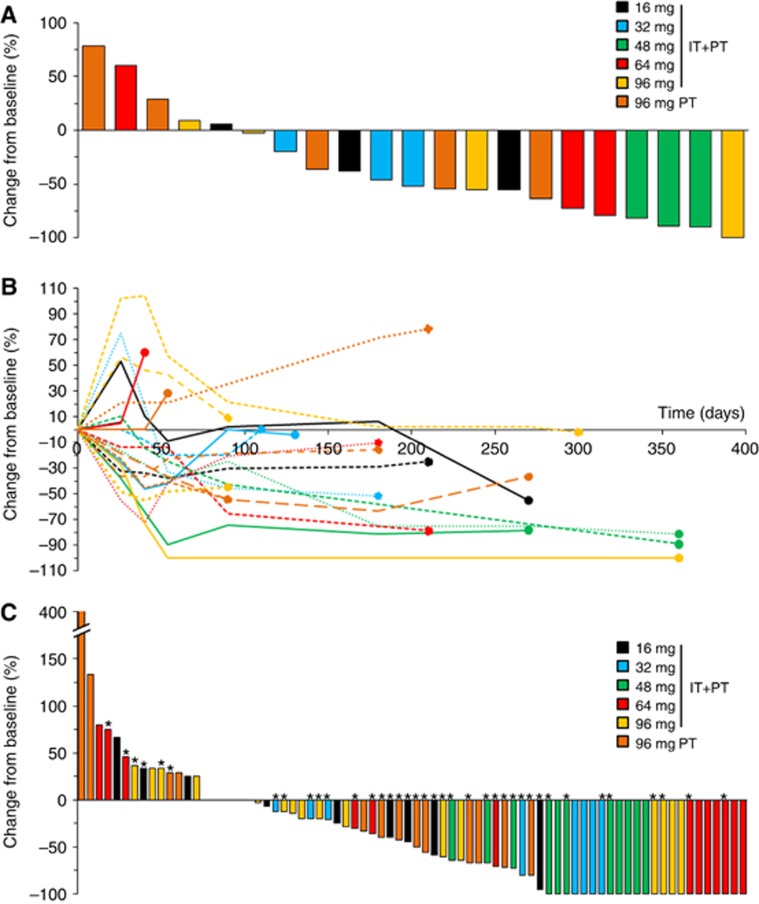
Figure 2.
Waterfall plots of best overall response according to modified RECIST criteria in the 21 evaluable patients for efficacy.(A) Overall response per patient. (B) Patient responses over time. The dots represent patient exit from the study. (C) Best overall response per treated tumour lesion in the 76 lesions treated with RT with or without DT01 injection. *DT01-injected lesions (both IT+PT and PT-treated lesions). A full colour version of this figure is available at the British Journal of Cancer journal online.

