. 2016 Jun 1;69(3):211–218. doi: 10.4097/kjae.2016.69.3.211

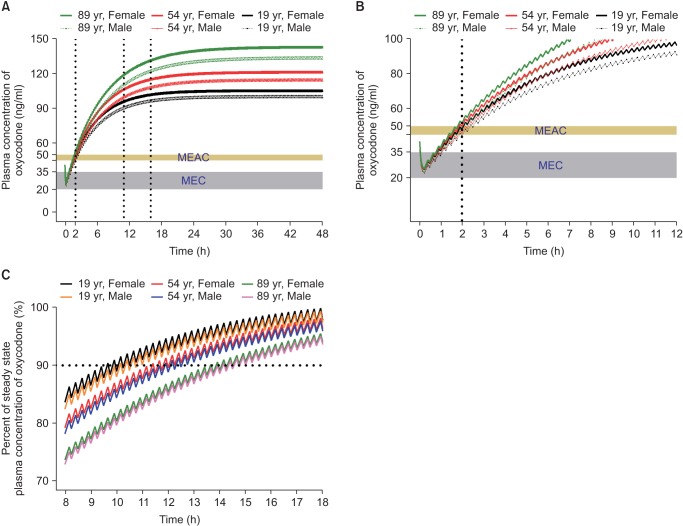
Fig. 3. Predicted concentration of oxycodone in the plasma over time after IV administration of a bolus of 0.1 mg/kg followed by demand boluses of 1 mg every 15 minutes and background infusion of 1 mg/h. (A) The entire time–concentration curve. (B) Time–concentration curve of time to reach MEAC. (C) Time–concentration curve of time to reach 90% steady-state concentration of oxycodone. Body weights and heights of all individuals were 60 kg and 165 cm, respectively. MEAC: minimum effective analgesic concentration, MEC: minimum effective concentration. Demand bolus, background infusion rate, and lock-out time of postoperative IV patient-controlled analgesia (IV PCA) were set at 1 ml, 1 ml/h, and 15 minutes, respectively. The concentration of oxycodone in IV PCA was 1 mg/ml. The pharmacokinetic model of Saari et al. was applied to this simulation [37]. Vertical dotted lines indicate time to reach MEAC (2 hours) and 90% steady-state concentration (9–14 hours). Time 0 indicates the end of surgery.

Fig. 3