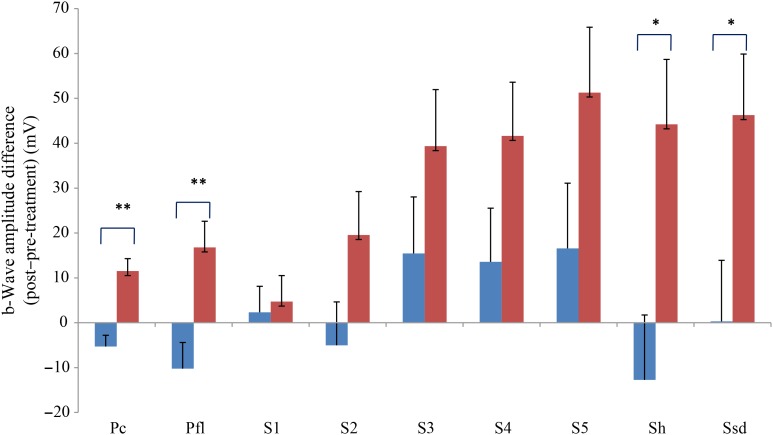
Fig. 2.
b-Wave amplitude difference from post- to pre-treatment tests in treatment ( ) v. control (
 ) groups. Ssd and Sh: with higher light intensity stimulation (Ssd and Sh: 3 and 10 cd·s/m2, respectively) in the dark-adapted state, a- and b-wave responses are obtained, demonstrating mixed rod and cone function. Pc and Pfl: rods are desensitised using 30 cd·s/m2 of background light for 10 min, after which cones are stimulated using 3 cd·s/m2 in the light-adapted state. Pc and Pfl: single flash and 30 Hz flicker. S (S1–S5): using low intensity of light stimulation (0·01 cd·s/m2) in the dark-adapted state every 4 min up to 20 min of dark adaptation; using this low light intensity only the b-wave is obtained, corresponding to activity from the rod photoreceptors. Values are means, with standard errors represented by vertical bars. Significant treatment × time interaction: * P < 0·05, ** P < 0·01. Ssd, electroretinography response from scotopic standard-intensity light stimulation; Sh, response from scotopic high-intensity light stimulation; Pc, photopic cone response; Pfl, photopic flicker (30 Hz) response.

