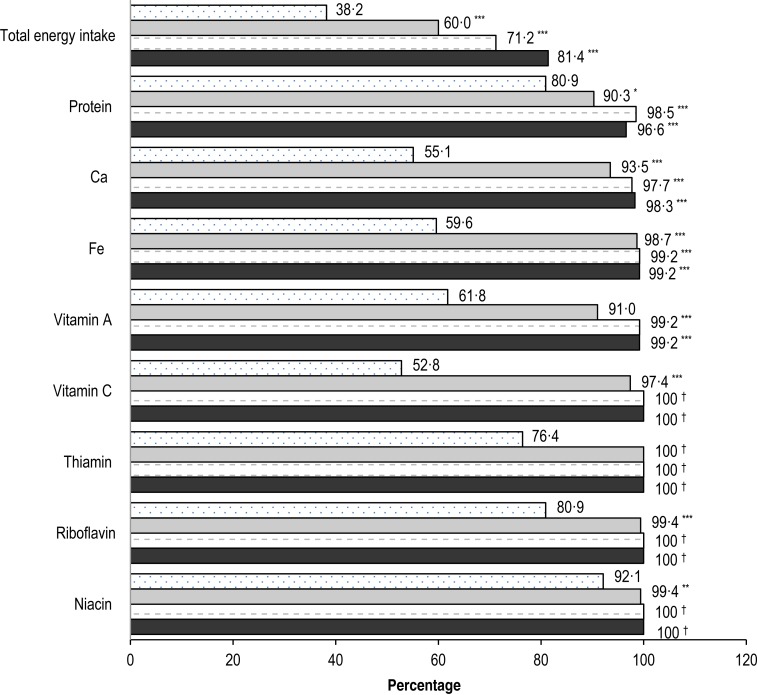
Fig. 1.
Percentage of children with adequate nutrient intakes at baseline (░), and at weeks 4 ( ), 32 (=) and 48 (■). P values are from McNemar's test and controlled for multiple comparisons using step-down Bonferroni adjustment: * P < 0·05, ** P < 0·01, *** P ≤ 0·0001. † McNemar's test could not be performed since all values were adequate.

