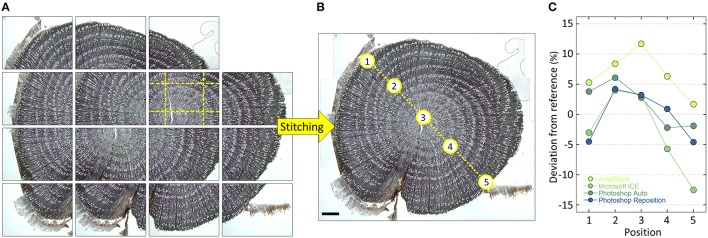
Figure 8.
(A) Overlapping high-resolution images stitched together using PTGui and (B) the obtained high-resolution image of an entire Verbascum thapsus root cross-section. The used overlap with neighboring images is visualized for one of the images with yellow dashed lines in (A). The input images contained distortions introduced by the used optical system, which were successfully removed by PTGui (verified by creating a composite image of a stage micrometer and measuring the distances between tick marks, which yielded constant values throughout the image). Five randomly selected vessels along a transect (see labels in B) having an lumen area between 100 and 3500 μm2 were subsequently measured using ROXAS (Table 1) using always the same settings in images stitched with the software PTGui, AutoStitch, Microsoft Image Composite Editor and Photoshop (Automatic and Reposition settings). Panel (C) shows the percentage deviation of the obtained values compared to the PTGui reference values. The values in all used stitching tools and settings deviate from the PTGui reference, thus indicating distortions. In addition, the magnitude of the deviations varied along the transect often changing from over- to under-estimation. Note that Photoshop Reposition setting also produces distortion-free images if input images are already distortion-free, while AutoStitch still introduces distortions. Scale bar = 1 mm.

