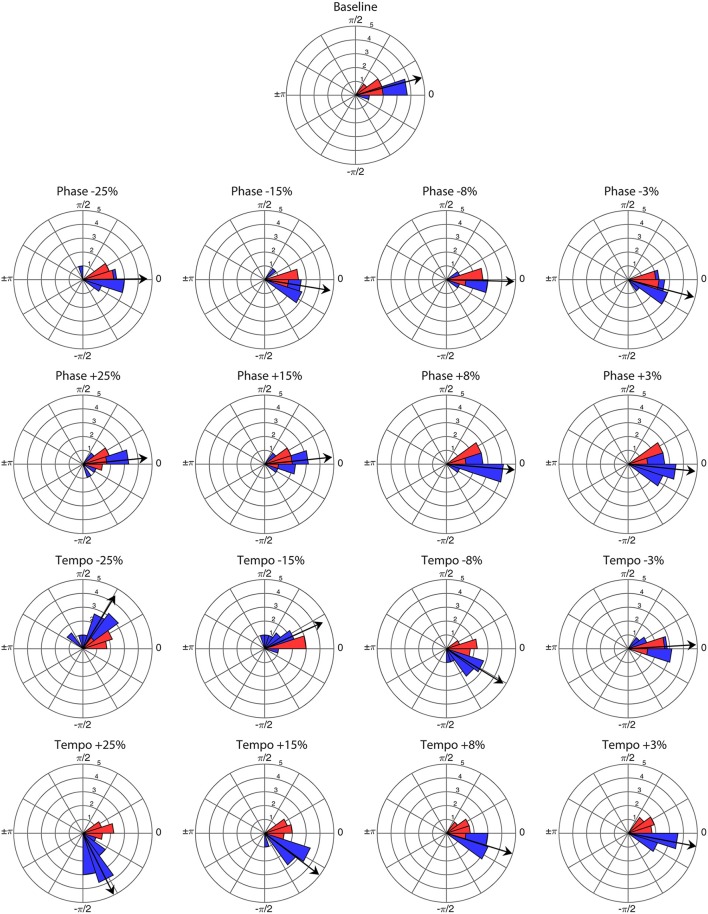
Figure 1.
Angular distribution of phase angles for the first presentation of each perturbation condition (n = 16) and baseline trial (n = 1) at a base tempo of 85 bpm. Red wedges show 10 bobs prior to the perturbation and blue wedges show 25 bobs following. The radius of each wedge represents the square root of the number of bobs in that wedge, so that the area of each wedge is equal to the number of bobs. The arrow indicates the mean vector of the post-perturbation bobs, with length normalized to the outer radius of the plot. Note that angles >0 represent bobs trailing the stimulus beat, and angles <0 represent bobs leading the stimulus beat.

