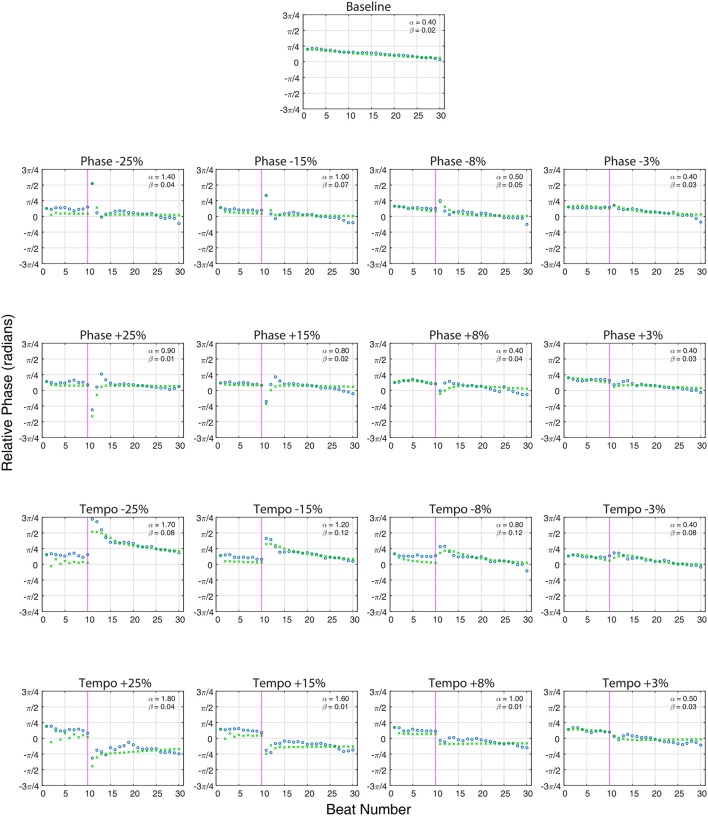
Figure 3.
The averaged relative phase in radians (Y-axis) over successive beats (X-axis) for averaged baseline trials (n = 80, top) and each averaged perturbation condition (n = 10 per condition) at a base tempo of 85 bpm. Ronan's results (circles) are plotted against the model predictions (x's). The close alignment of the model predictions to the experimentally obtained values indicate that Ronan's responses to these perturbations are consistent with the model of coupled oscillation. On perturbation conditions, the vertical line at 10 beats indicates the onset of the tempo or phase shift indicated at the top of the plot. Phase (α) and period (β) coupling factors are noted in the upper right portion of each plot.

