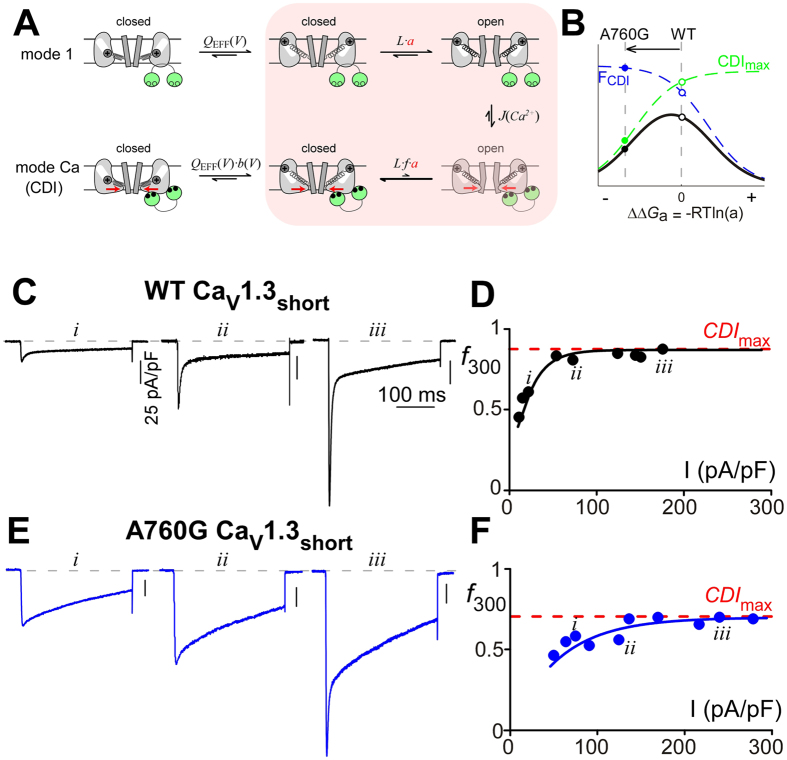
Figure 2. An allosteric mechanism underlying the CDI reduction.
(A) Diagram representing an allosteric model of CDI. Channels transition from mode 1 with high PO, to mode Ca2+ with lower PO, in response to Ca2+ entry. Equilibrium constants QEFF (concerted movement of S1–S4 segments), L (S6 movement), and a (mutation effect) govern transitions between open and closed channel configurations14,38, while the effective equilibrium constant J(Ca2+) governs entry into mode Ca2+. The parameter f (0 < f < 1) scales the PO in mode Ca2+ resulting in CDI. State transitions expected to be effected by the A760G are shaded pink. (B) Total CDI (black), the product of FCDI (blue) and CDImax (green), is plotted as a function of ∆∆Ga for the model shown in panel A. The A760G mutation left-shifts voltage activation (∆∆Ga < 0, a > 1), predicting a decrease in CDI due to a decrease in CDImax. (C) Exemplar Ca2+ current traces through WT CaV1.3short channels. Larger current amplitudes (ii, iii) allow a greater influx of Ca2+, enhancing entry into mode Ca and thus increasing CDI as compared to diminutive Ca2+ currents (i). (D) f300 values for individual cells expressing WT CaV1.3short are plotted as a function of current density. The curve saturates at CDImax ~0.9 (red dashed line). Traces in C correspond to i–iii. (E) Exemplar Ca2+ current traces through A760G CaV1.3short channels. Similar to that of WT (C), larger current amplitude increases f300 values. (F) Population data representing CDI of A760G CaV1.3short channels. f300 values saturate at CDImax ~0.7 (red dashed line), significantly lower than WT.

