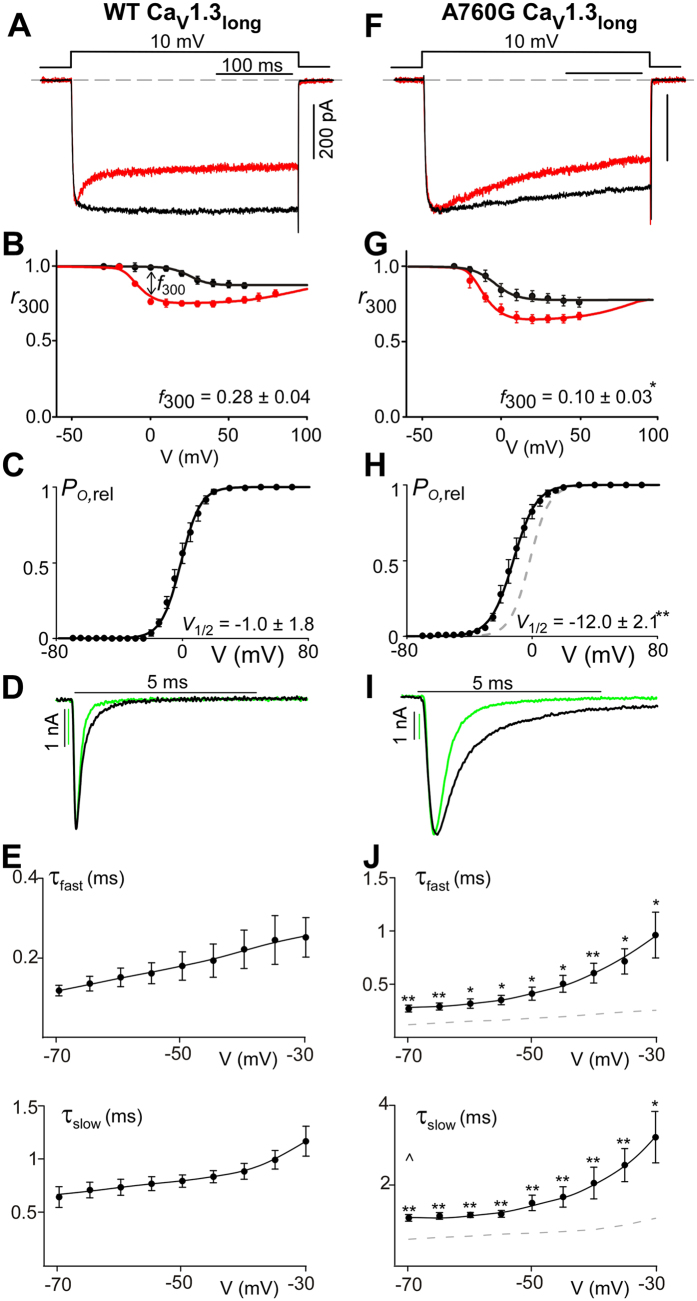
Figure 3. CDI reduction due to A760G mutation within the CaV1.3 long variant.
(A) Exemplar Ca2+ (red) and Ba2+ (black) current traces through the alternate splice variant CaV1.3long illustrating decreased CDI as compared to the short splice variant (Fig. 1B). (B) Despite the reduction in magnitude, significant CDI is demonstrated by the difference in r300 for Ca2+ (red) and Ba2+ (black), plotted across multiple voltages. (f300 = 0.28 ± 0.04, n = 3). (C) Voltage activation curve for Ba2+ current through WT CaV1.3long channels (V1/2 = −1.0 ± 1.8 mV, n = 5). (D) Exemplar Ba2+ tail currents obtained from a transition from 80 mV to −40 mV (black) and −60 mV (green). Traces are normalized to one another such that the scale bars correspond to the traces of the same color. (E) Population data of the fast (top) and slow (bottom) deactivation time constants (τ) plotted as a function of voltage. Error bars indicate ± SEM, n = 5. (F) Exemplar current traces through A760G CaV1.3long channels depicting diminished CDI as compared to WT channels. (G) Population data for r300 (red = Ca2+, black = Ba2+) plotted across multiple voltages (f300 = 0.10 ± 0.03; n = 4, *p < 0.05). (H) The activation curve of A760G CaV1.3long channels (black, V1/2 = −12.0 ± 2.1 mV, n = 4) shows an 11-mV hyperpolarizing shift (**p < 0.01) compared to WT (reproduced in gray for reference). (I) Exemplar Ba2+ tail currents for the A760G CaV1.3long channel, obtained from a transition from 80 mV to −40 mV (black) and −60 mV (green). Traces are normalized to one another such that the scale bars correspond to the traces of the same color. (J) Population data of the fast (top) and slow (bottom) deactivation time constants (τ) plotted as a function of voltage for the A760G CaV1.3long channel. Deactivation is significantly slowed as compared to WT reproduced as the gray dashed line (*p < 0.05, **p < 0.01). Error bars indicate ± SEM, n = 4.

