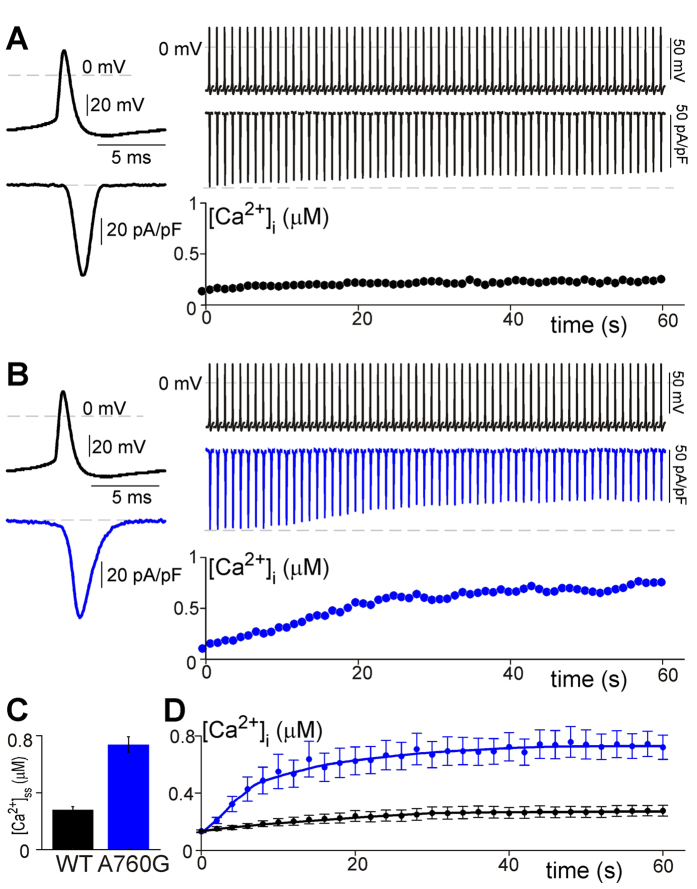
Figure 5. Effects of A760G on cytosolic Ca2+.
(A) Exemplar Ca2+ currents in response to a 1-Hz train of neuronal action potentials delivered to HEK293 cells expressing WT CaV1.3short channels. On the left, a single action potential and corresponding Ca2+ current is displayed on an expanded time course for resolution. Each action potential (top) and corresponding current response (middle) is magnified for display purposes and represents a 23 ms interval. The peak of each action potential is aligned with the time course displayed on the bottom panel. Note the gradual decrease in peak current as the level of cytosolic Ca2+ (bottom right panel) rises. (B) Exemplar Ca2+ currents in response to a 1-Hz train of neuronal action potentials delivered to HEK293 cells expressing A760G CaV1.3short channels. On the left, a magnified view demonstrates an increased duration of Ca2+ entry (blue) during a single action potential as compared to WT (A). At a comparable current density, A760G causes considerably more cytosolic Ca2+ accumulation (bottom right panel) as compared to WT channels. This increased cytosolic Ca2+ persists despite causing an enhancement of CDI (middle right panel). (C) Steady state level of intracellular Ca2+ in response to a 1-Hz train of action potentials. [Ca2+]ss is measured after 60 s of stimulation. A760G CaV1.3 channels display significantly higher levels of [Ca2+]ss than WT channels (WT: 0.28 ± 0.05, n = 7; A760G: 0.73 ± 0.13, n = 8; p < 0.01). (D) Average [Ca2+]i as a function of time as HEK293 cells expressing WT or A760G CaV1.3short channels are stimulated by a train of 1-Hz action potential. Error bars indicate ± SEM, n = 7, 8 for WT and A760G respectively.

