
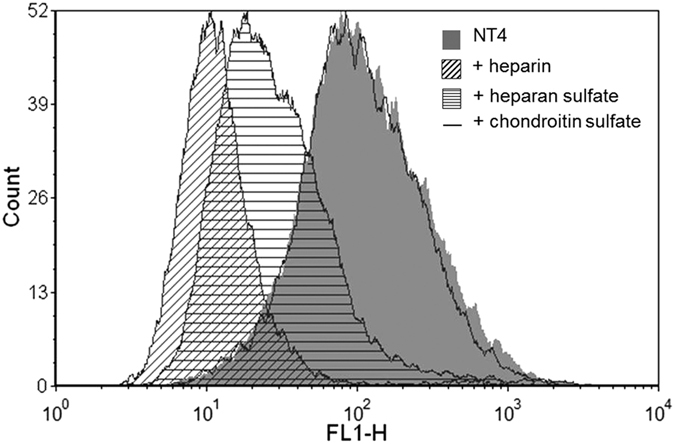
Figure 2. Flow cytometry of NT4 binding (grey) to PANC-1 cancer cells and inhibition by heparin (oblique lines), heparan sulfate (horizontal lines) and chondroitin sulfate (line).
Official websites use .gov
A
.gov website belongs to an official
government organization in the United States.
Secure .gov websites use HTTPS
A lock (
) or https:// means you've safely
connected to the .gov website. Share sensitive
information only on official, secure websites.