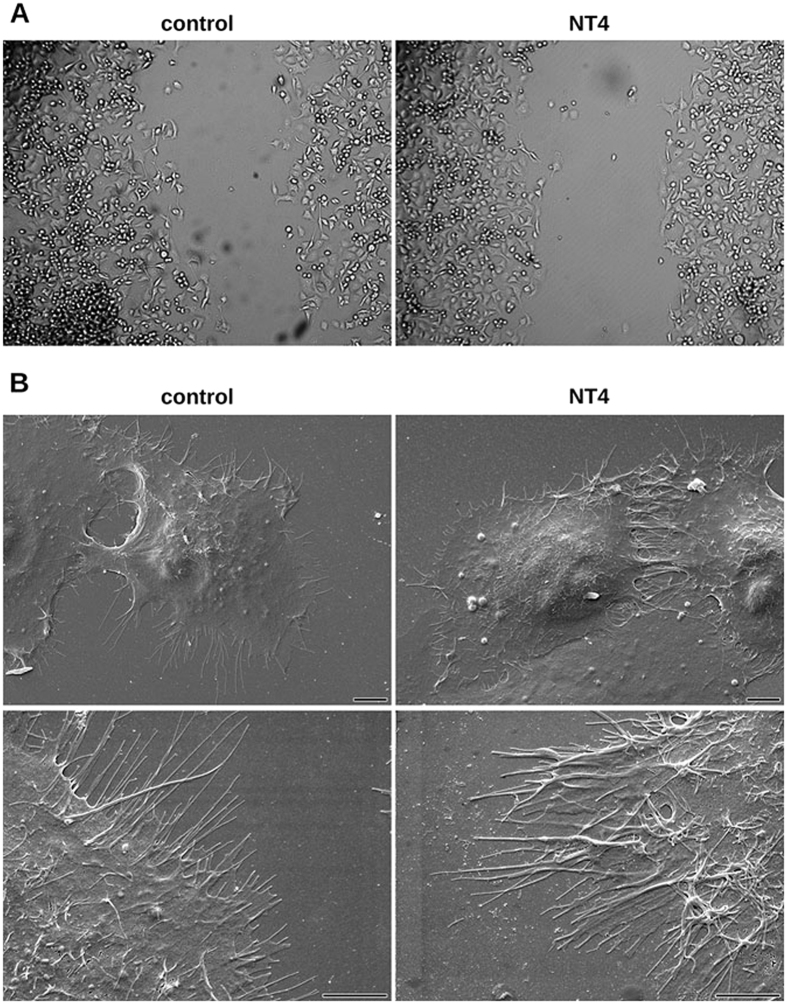
Figure 6.
Cancer cell morphology of PANC-1 in control wells (left panels) and in the presence of 10 μM NT4 peptide (right panels) analyzed by phase contrast light microscopy in wound healing experiments (A) (images taken after 3-hour time lapse analysis of cell migration. Magnification 10x) and by scanning electron microscopy under static conditions (B). Scale bar 5 µm.

