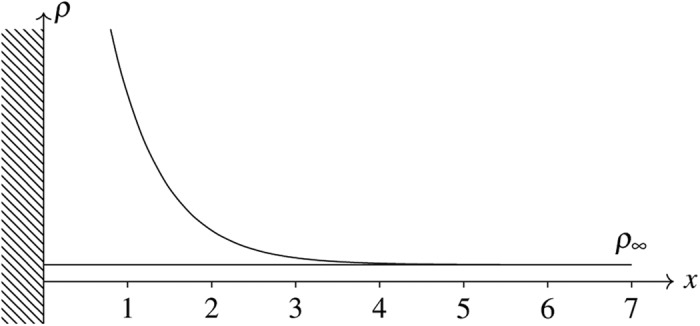
Figure 3. Schematic plot of the one-dimensional lattice.

The area under the density profile is the absolute adsorption amount whereas that between the density profile and the ρ = ρ∞ line is the Gibbs amount.

The area under the density profile is the absolute adsorption amount whereas that between the density profile and the ρ = ρ∞ line is the Gibbs amount.