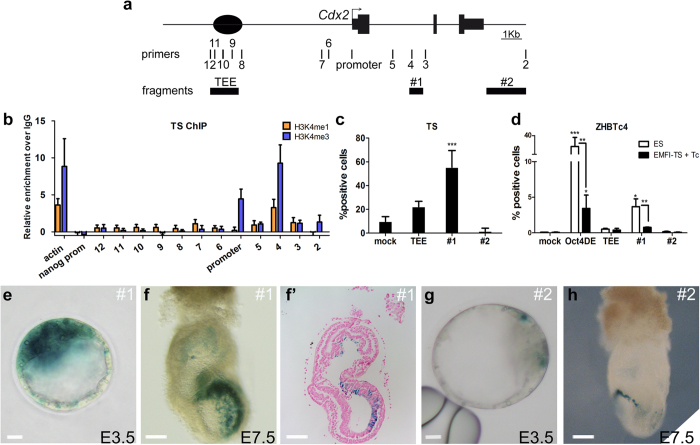
Figure 3. Activity of regulatory elements in the Cdx2 locus.
(a) Diagram of the Cdx2 locus, showing relative positions of primers selected for ChIP-qPCR (2–12) and of the selected regulatory elements. (b) Relative enrichment over IgG of H3K4me1 (orange) and H3K4me3 (blue) along the Cdx2 locus in the chromatin of TS cells; Actin promoter, positive control; Nanog promoter, negative control. Data are means ± s.e.m. n = 2. (c) TS transfection of different Cdx2 regulatory fragments. Fragments were tested for regulatory capacity, and expression was compared to level obtained with empty vector (mock). Data are means ± s.e.m. n = 3. ***p < 0.001 compared with mock (Student’s t-test). (d) Percentage of ZHBTc4 cells showing reporter expression in transient transfections upon Tc addition. Data are means ± s.e.m. n = 3: ***p < 0.001, *p < 0.05 versus mock; **p < 0.01 between cells expressing the same fragment but maintained in ES medium versus EMFI medium + Tc (Student’s t-test). (e–h) lacZ reporter activity driven by fragment #1 (e,f) and fragment #2 (g,h) in transient transgenic embryos at E3.5 (e,g; scale bar 10 μm) and E7.5 (f,h). (f’) is a sagittal section of the embryo shown in (f); scale bar 110 μm.

