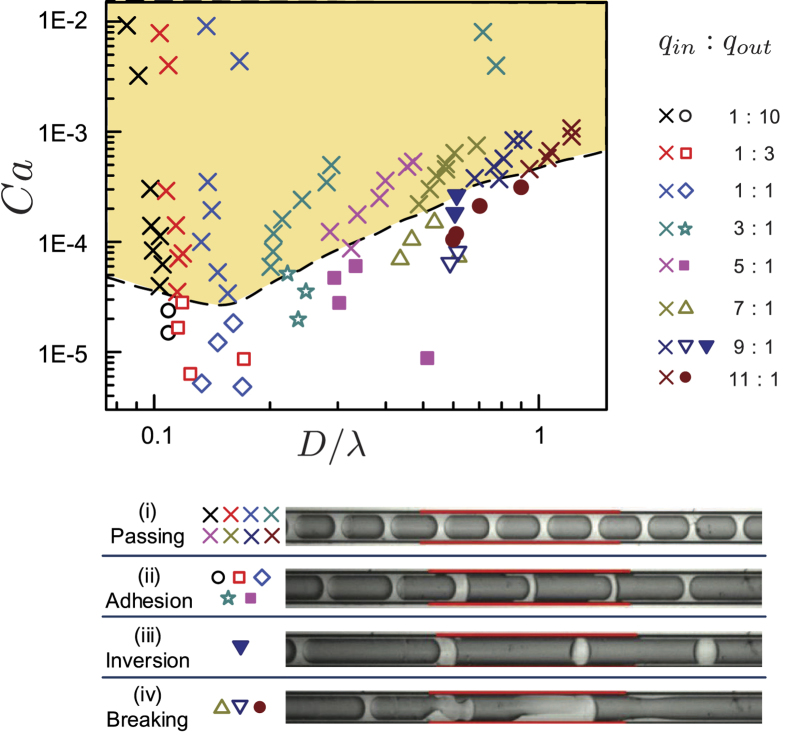
Figure 3.
(Supporting movies) Phase diagram of (oil-in-water) emulsion dynamics after passing a hydrophobized section (marked in red along the micro-capillary), revealing the effects of droplet size and velocity, in terms of the Capillary number Ca = μU/σ, on the changing behaviors of the droplets. The upper (shaded) regime above the dashed line indicates (i) passing oil-in-water droplets without changing their size or speed (×) for different flow rates. In contrast, at lower speeds (below the dashed line) critical changes are observed, including (ii) adhesion of oil droplets on the hydrophobic wall with an increasing advancing contact angle (◦, ▫, ◊,  , ■), (iii) inversion of oil droplets to become water-in-oil emulsions (▼), and (iv) break-up of the oil droplets with unstable lubrication films (Δ, ∇, ●). See Supplementary information for the details.

