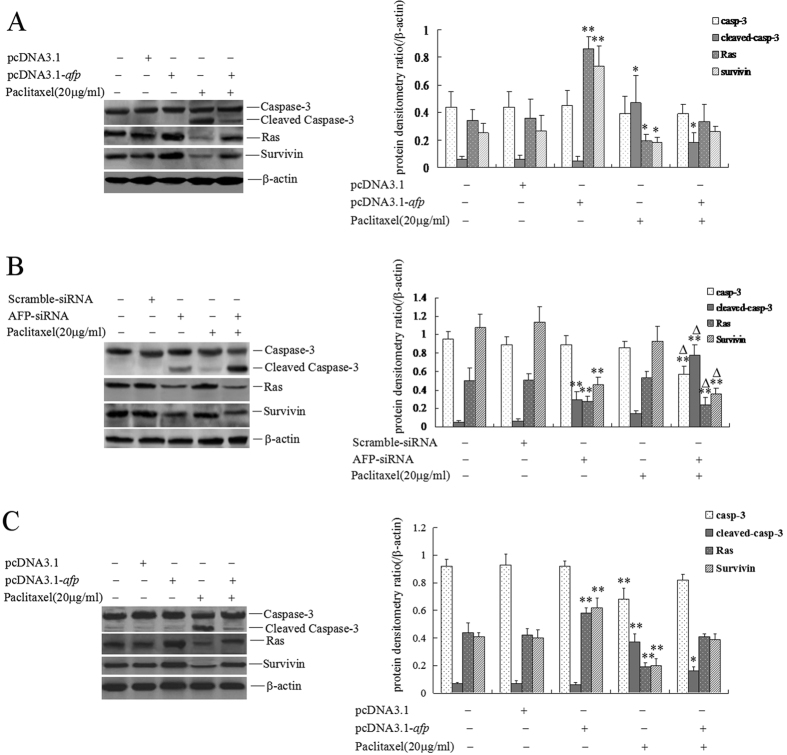
Figure 6. Effects of AFP and paclitaxel on the expression of caspase-3, Ras and Survivin in hepatoma cells and L-02 cells.
(A) HLE cells were treated with paclitaxel at a concentration of 20 μg/ml and transfected with pcDNA3.1-afp vectors for 24 hrs. Followed treatment with paclitaxel (20 μg/ml) for 24 hrs, the expression of caspase-3, cleaved caspase-3, Ras and survivin in the cells was detected by Western blotting. The right columnar images represent the protein densitometry values compared to the internal control β-actin ratio. *P < 0.05 vs untreated groups, pcDNA3.1 treated group and pcDNA3.1-afp treated groups; **P < 0.01 vs untreated groups, pcDNA3.1 treated group and pcDNA3.1-afp and paclitaxel co-treated groups. (B) Bel 7402 cells were treated with paclitaxel at a concentration of 20 μg/ml and transfected with AFP-siRNA vectors for 24 hrs. Following treatment with paclitaxel (20 μg/ml) for 24 hrs, the expression of caspase-3, cleaved caspase-3, Ras and survivin in the cells was detected by Western blotting. The right columnar images represent the protein densitometry values compared to the internal control β-actin ratio. **P < 0.01 vs untreated groups, scramble-siRNA treated group and paclitaxel treated groups; *P < 0.05 vs AFP-siRNA treated groups, AFP-siRNA and paclitaxel co-treated groups. (C) L-02 cells were treated with paclitaxel at a concentration of 20 μg/ml and transfected with pcDNA3.1-afp vectors for 24 hrs. Following treatment with paclitaxel (20 μg/ml) for 24 hrs, the expression of caspase-3, cleaved caspase-3, Ras and Survivin in the cells was detected by Western blotting. The right columnar images represent the protein densitometry values compared to the internal control β-actin ratio. *P < 0.05 vs untreated groups, pcDNA3.1 treated group and pcDNA3.1-afp treated groups; **P < 0.01 vs untreated groups, pcDNA3.1 treated group and pcDNA3.1-afp and paclitaxel co-treated groups. The images are a representation of at least three independent experiments.

