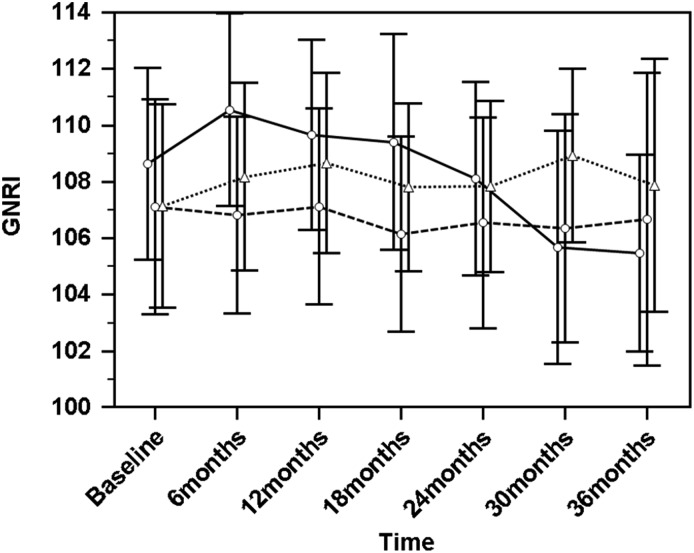
Figure 2.
Comparison of changes in geriatric nutritional risk index (GNRI) levels over a period of 36 months in the tertiles of absolute changes in serum uric acid (ΔSUA) over the same period. The first tertile is uric acid decrease to <−0.8 mg/dl (circles and solid line). In this group, SUA declined significantly over time: the estimate was −0.21 (95% confidence interval, −0.25 to −0.16; P<0.001). The second tertile is change of SUA between −0.8 and 0.2 mg/dl (circles and dashed line). SUA decline was statistically significant but more gradual (−0.05; 95% confidence interval, −0.08 to −0.02; P=0.002). The third tertile is uric acid increase to >0.2 mg/dl (triangles and dotted line); in this group, SUA increased significantly over time (0.08; 95% confidence interval, 0.03 to 0.13; P=0.002). In the whole cohort, GNRI declined during the study period (−0.33; 95% confidence interval, −0.49 to −0.17; P<0.001; crude analysis), whereas a statistically significant decline was observed only in the first tertile of the ΔSUA over time (−0.80; 95% confidence interval, −1.11 to −0.48; P<0.001), and GNRI did not change in the second (−0.15; 95% confidence interval, −0.43 to 0.12; P=0.27) and third (−0.06; 95% confidence interval, −0.30; 0.19; P=0.66) tertiles of ΔSUA. Data are presented as means with 95% confidence intervals.

