Figure 6.
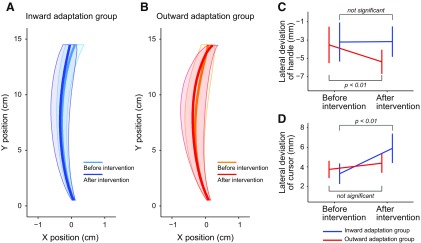
Kinematics of the movement. A, B, The trajectories of the handle during movement to the central target (the cursor was visible) before and after intervention for the inward (A) and for outward (B) adaptation groups are shown. Solid bold lines indicate the averaged trajectory of participants. Shaded areas indicate SD. Note that the scale for the x-direction is exaggerated. C, The handle’s x-position during peak velocity was quantified to examine the shape of the trajectories. After intervention, the values became significantly smaller by 1.9 mm only for the outward adaptation group, indicating that the trajectories were slightly curved leftward. D, The lateral deviation of the cursor’s direction at peak velocity from the target direction (left, central, and right targets) was quantified by taking the root mean squared value for each participant. After intervention, the deviation significantly increased only in the inward adaptation group. In C and D, error bards indicate SD.

