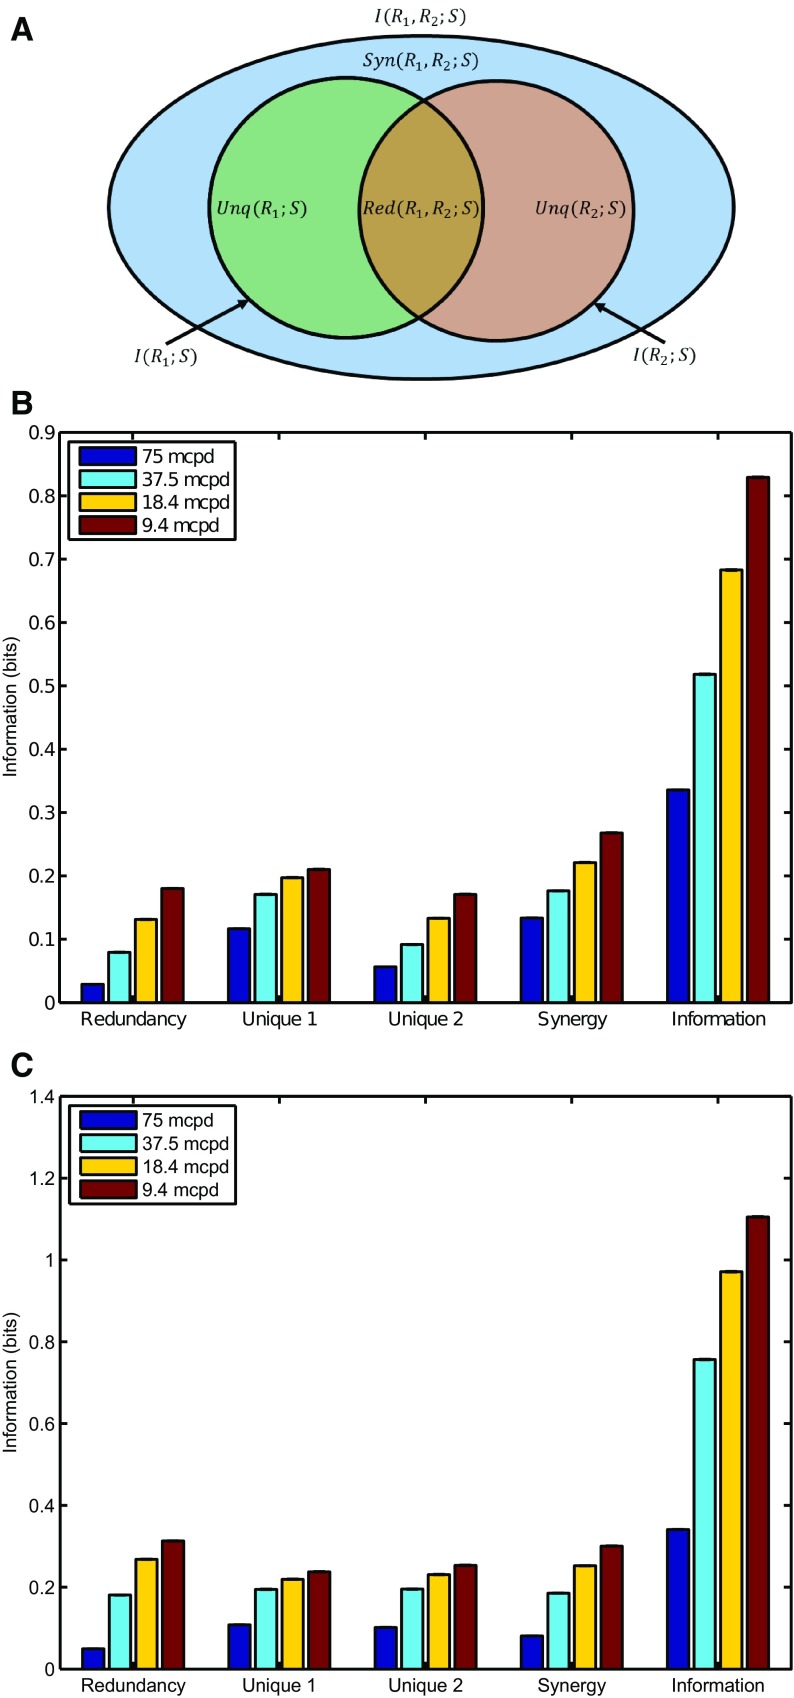
Figure 3.
A, Partial information diagram for two variables, based on Williams and Beer (2010), their Figure 1. The two inner circles represent the mutual information between two variables, R1 and R2, considered separately, and a third variable S. Where they overlap is the redundant information; where they do not is the unique information provided by each. The outer ellipse represents the mutual information between the pair (R1,R2) and S. The area not covered by the inner circles is the synergistic information. Decomposition of the information using PID for (B) dataset D1 and (C) dataset D2. The histograms show the amount of redundant, unique, and synergistic information for the four different spatial frequencies (9, 18, 37, and 75 mcpd). Error bars show standard error on the mean (SEM), but due to the large number of pairs sampled they are too small to be visible.

