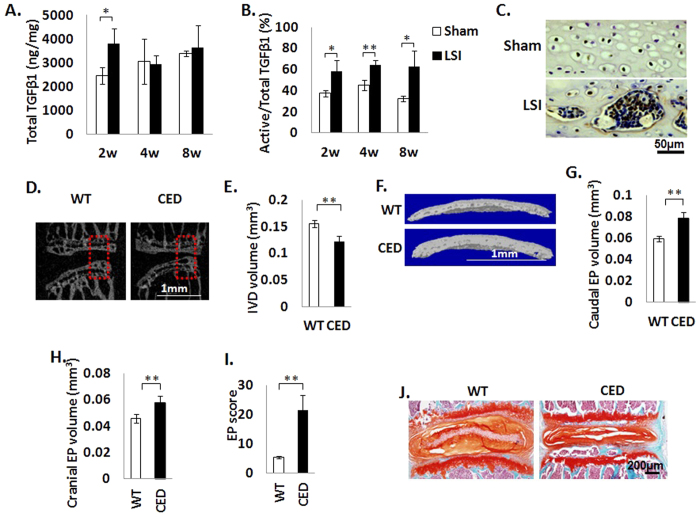
Figure 4. Upregulation of active TGFβ leads to EP hypertrophy and narrowed IVD space.
(A,B) ELISA assay showing total TGFβ (A) or percent of active versus total TGFβ (B) in IVD at 2, 4 and 8 weeks post-sham or LSI surgery. n = 3 per group. (C) Immunostaining for pSmad2/3. Nuclei counterstained with hematoxylin (purple). (D) Mid-sagittal 3-D images of L4–L5 of CED and WT mice. Scale bar, 1 mm. Red rectangle represents the region of interest (ROI) chosen for calculation of IVD volume shown in (E). (F) μCT 3-D images of cranial EP of CED mice and their WT littermates. Scale bar, 1 mm. (G,H) Quantitative analysis of ROI of cranial (G) and caudal (H) EP volume. (I) EP score of CED mice and their WT littermates as an indication of EP degeneration. (J) Safranin O-Fast Green staining of IVD sections showing increased ossification (green) of EP and decrease of IVD height in CED mice. Scale bar, 200 μm. n = 6 per group. Data are shown as mean ± s.d. *p < 0.05, **p < 0.01.

